



- Published on: 2026-08-01 10:11:31
Combining Technical Indicators Effectively: Building Your 2026 Trading Edge

Most traders treat their charts like a cluttered attic, stacking tool upon tool only to find themselves paralyzed when the signals inevitably clash. You've likely felt that sting of hesitation, watching a prime entry vanish while you wait for three redundant oscillators to finally align. Mastering the art of combining technical indicators effectively is your path to institutional-grade clarity. It's time to stop chasing lagging signals and start anticipating market shifts with a clean, synergistic setup.
The 2026 trading landscape demands absolute precision. With the elimination of the Pattern Day Trader rule earlier this year, the market is more accessible than ever, but it also rewards those with the sharpest execution. We'll show you how to build a repeatable framework that eliminates noise and fuels your execution confidence. This article breaks down the exact synergy required for elite performance and high-speed results. Discover how to leverage our Scalp or Pro Account infrastructure to turn these high-precision insights into decisive market wins.
Key Takeaways
- Eliminate the "Noise Trap" by aligning diverse data categories rather than stacking redundant, conflicting indicators that lead to analysis paralysis.
- Master the "Power of Three" rule to build high-precision charts that maintain institutional-grade clarity even in volatile market conditions.
- Learn the blueprint for combining technical indicators effectively by balancing lagging trend filters with leading momentum oscillators for superior entry timing.
- Optimize your execution speed by matching your specific strategy to specialized infrastructure like the Scalp Account for high-frequency setups.
- Leverage Social Trading as the ultimate confirmation tool by observing how elite market leaders synchronize their technical toolkits in real-time.
The Science of Indicator Synergy: Why Most Traders Fail
Most traders treat their screens like a cockpit without a manual. They stack five tools and wonder why they're frozen when the market moves. True mastery isn't about volume; it's about synergy. Synergy is the mathematical alignment of diverse data points to confirm price action. When you're combining technical indicators effectively, you aren't just looking for more lines on a chart. You're building a filter for institutional-grade clarity. This isn't just about trading. It's about dominating the landscape with a system that works as hard as you do. You need a setup that speaks one language: profit.
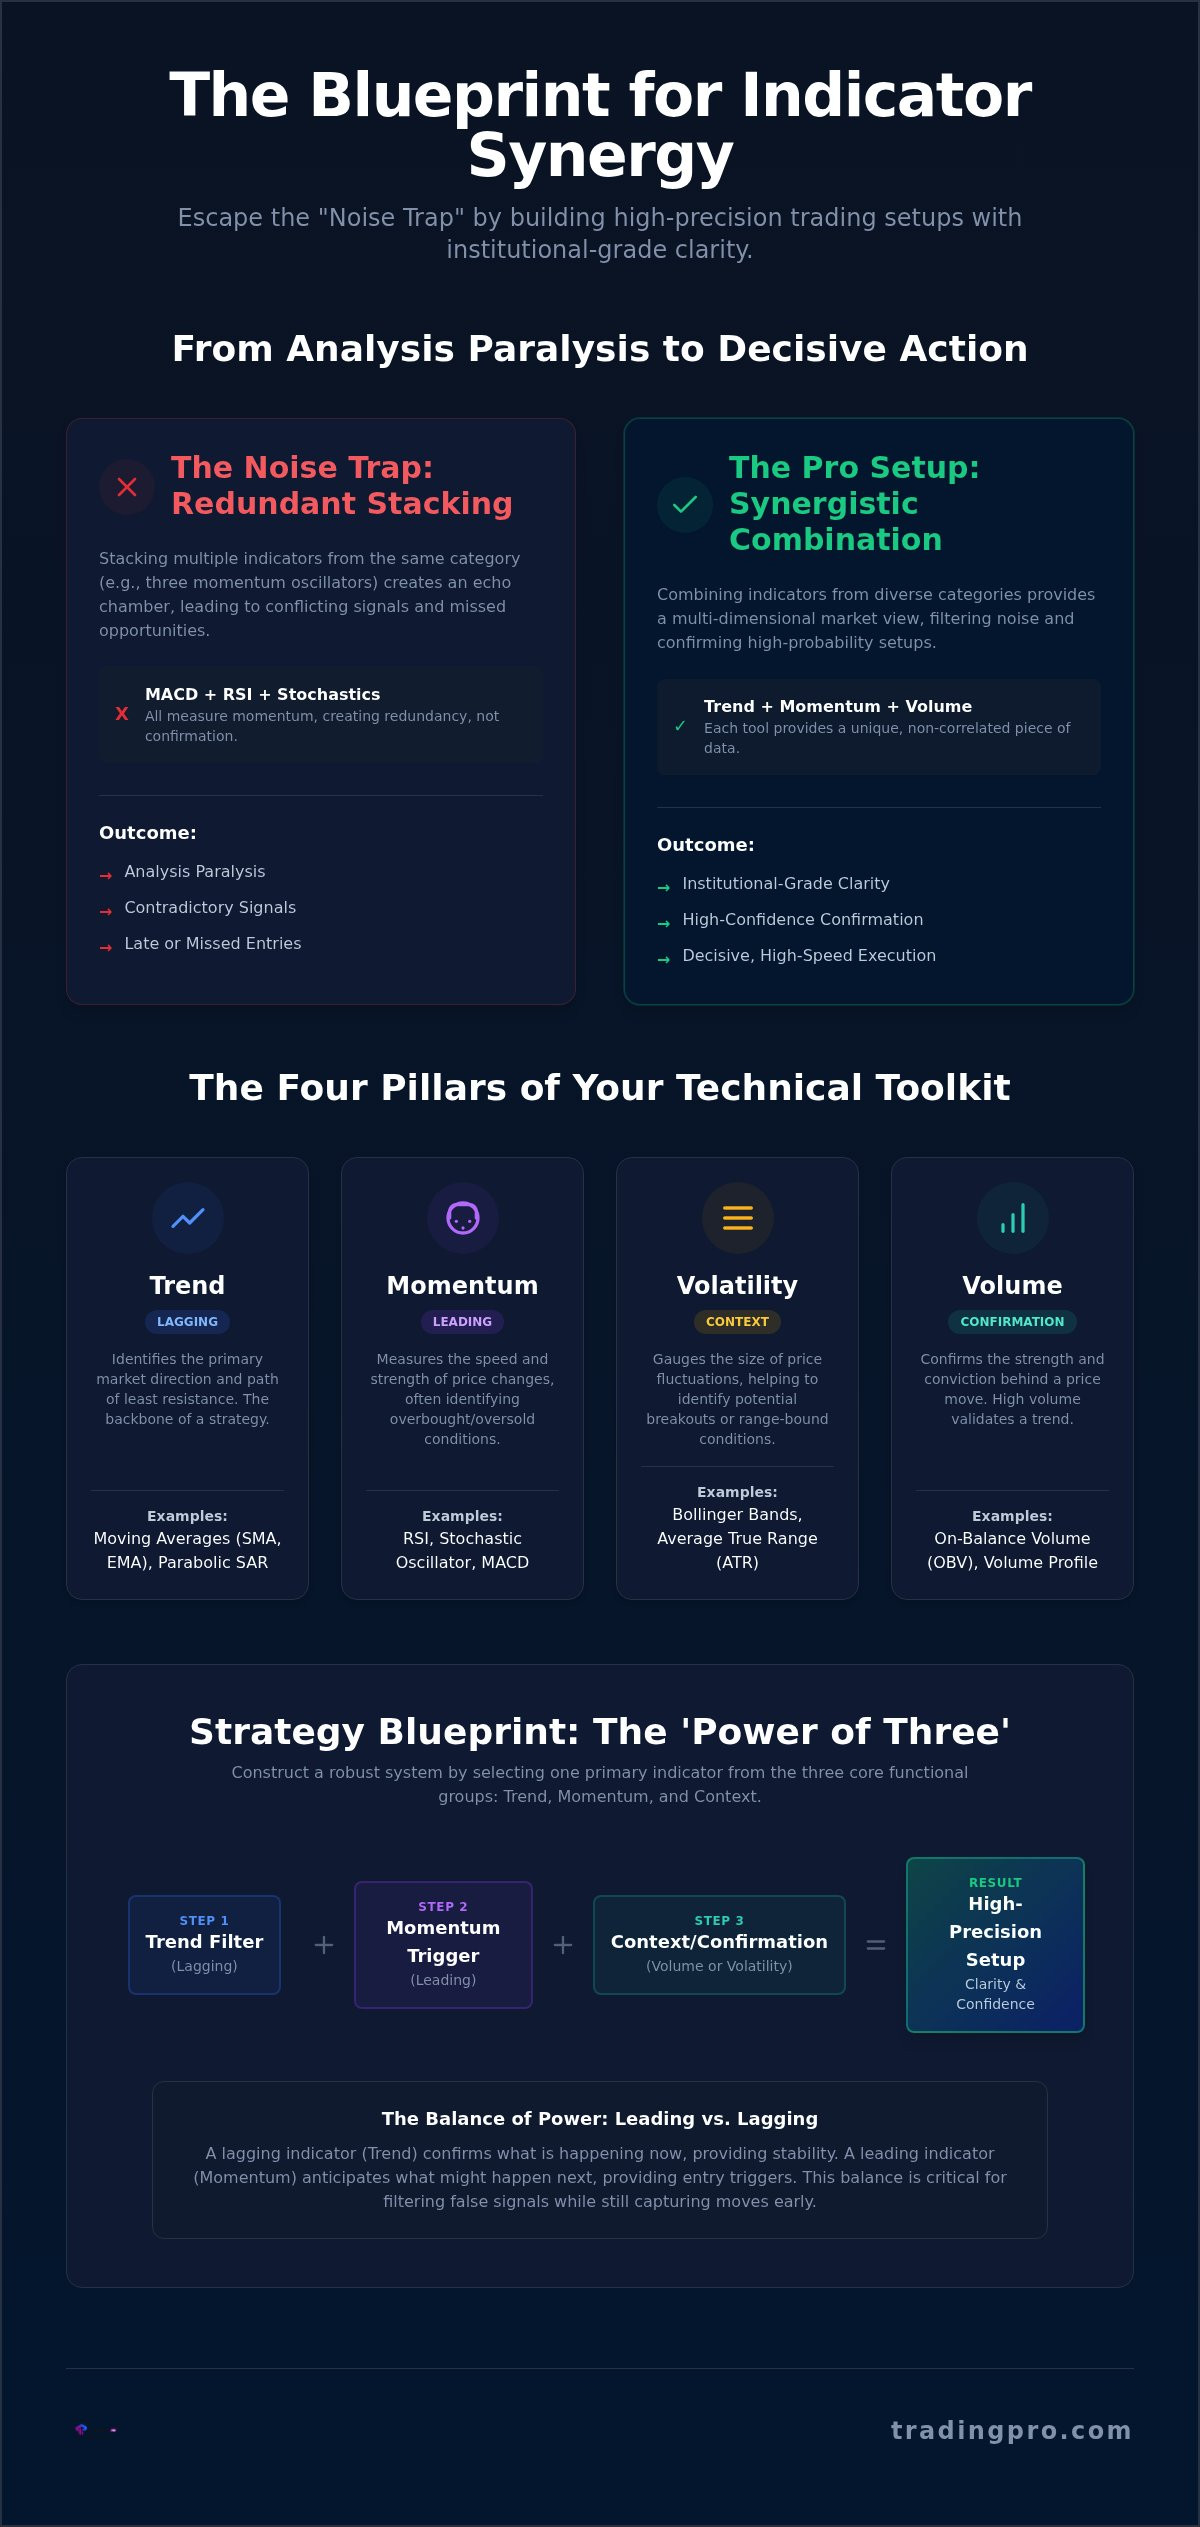
Every additional indicator that measures the same variable increases the "Noise Trap." If you use three oscillators, you aren't getting triple confirmation. You're getting triple redundancy. This leads to analysis paralysis. The window for a high-precision entry closes while you wait for every line to point in the same direction. The goal is to use technical indicators to filter out false breakouts and confirm setups that have a genuine statistical edge. Elite traders don't need a crowded chart. They need a clean one. By focusing on non-correlated data, you eliminate the mental friction that causes missed trades. Stop chasing signals. Start confirming opportunities with professional-grade focus.
The Redundancy Trap: MACD, RSI, and Stochastics
Stop stacking MACD, RSI, and Stochastics. These tools often derive their data from similar price-over-time calculations. They usually show identical momentum shifts. Stacking them creates a false sense of confidence that isn't backed by independent data. It's an echo chamber for your bias. This redundancy kills execution speed and leads to late entries. Combining technical indicators effectively requires you to pick one momentum tool and pair it with a trend or volume indicator instead. You need tools that look at the market from different angles; not tools that repeat the same story in different colors.
The 2026 Market Landscape
The 2026 market moves faster than ever. High-frequency trading algorithms are designed to trigger standard indicator signals just to create liquidity for fake-outs. Traditional settings often lag behind this modern volatility. The elimination of the Pattern Day Trader rule in June 2026 has flooded the market with new participants, increasing the need for sophisticated risk management. Indicator synergy is the strategic combination of non-correlated technical tools. If you're testing new setups to combat this volatility, use a Rookie Account to refine your logic in a controlled environment. Precision is your only defense against the speed of the modern exchange.
The Four Pillars: Categorizing Your Technical Toolkit
Stop treating your indicator list like a grocery store checkout. Professional setups aren't built by stacking random tools; they're engineered using a structural pillar system. To succeed in 2026, you must understand that every indicator belongs to a specific functional family. Stacking tools from the same family is a rookie mistake that leads to redundant data and conflicting signals. Mastering these categories is the only way to begin combining technical indicators effectively without cluttering your interface with useless noise.
Your toolkit must address four distinct market dimensions. Trend indicators, such as Moving Averages, identify the path of least resistance. Momentum indicators, or oscillators, measure the speed and strength of price movement. Volatility indicators like Bollinger Bands gauge market range and potential breakout zones. Finally, volume indicators confirm the conviction behind price moves. By selecting one elite tool from each pillar, you create a comprehensive market matrix that offers institutional-grade clarity on every setup.
Trend vs. Momentum: Leading vs. Lagging
Lagging indicators provide the backbone of your strategy. They tell you where the market has been and where the current momentum is leaning. Leading indicators hint at what will happen next by identifying overbought or oversold conditions. A balanced system needs exactly one of each to function. If you use two trend indicators, you're just looking at the same data twice. Use the TradingPRO Trade Hub to monitor these metrics across multiple assets in real time. Academic research into an effective multi technical indicator strategy proves that category diversity is the only way to achieve consistent predictive power while minimizing false entries.
Volatility and Volume: The Context Builders
Volatility and volume are the context builders that separate professionals from amateurs. Tools like the Average True Range (ATR) don't predict direction, but they're essential for setting realistic stop-losses that won't get hunted by high-frequency algorithms. Volume remains the ultimate truth in technical analysis. While price can be manipulated in the short term, volume represents the actual capital commitment behind a move. If price breaks out but volume stays flat, the move is likely a trap. Combining technical indicators effectively means using volume to validate the trend and volatility to manage your risk. This synergy ensures you're never trading in a vacuum. Ready to deploy your own market matrix? You can register your professional account today and start backtesting these combinations with elite execution speeds.
Strategy Blueprint: The 'Power of Three' Combination
Minimalism is the ultimate sophistication in high-stakes trading. While amateurs clutter their screens with a dozen conflicting signals, elite performers adhere to the "Power of Three" rule. This framework dictates that you should never use more than three indicators on a single execution chart. By limiting your toolkit, you force yourself to focus on the highest-quality data points and eliminate the mental friction of analysis paralysis. Success in combining technical indicators effectively isn't about seeing everything; it's about seeing what matters with institutional-grade clarity.
To build a dominant strategy, you must follow a rigid sequence of confirmation. This ensures that every trade is backed by a logical confluence of non-correlated factors. Follow these three steps to build your execution matrix:
- Step 1: Define the Trend. Use a lagging indicator like a 200-period Exponential Moving Average (EMA) to identify the path of least resistance. If price is above the EMA, you only look for long entries.
- Step 2: Identify Overextended Conditions. Layer in a momentum oscillator like the Relative Strength Index (RSI). This tells you when a trend is pausing or when a reversal is imminent.
- Step 3: Confirm the Entry. Look for a volatility squeeze or a significant volume spike to validate the move. This is your trigger for execution.
Before risking live capital, you must prove your edge. Use a Rookie Account to backtest your specific combination. This environment allows you to refine your parameters and ensure your "Power of Three" setup delivers a consistent statistical advantage before you scale up to professional tiers.
Example Setup: The Trend-Momentum-Volatility Matrix
A classic professional setup uses the EMA for trend direction, the RSI for entry timing, and the Average True Range (ATR) for risk management. The EMA ensures you're on the right side of the market. The RSI prevents you from buying at the very top of a move. Finally, the ATR provides a data-driven stop-loss level that accounts for current market noise. This combination covers all four pillars discussed earlier without creating a single point of redundancy.
Filtering False Signals
The real power of this blueprint lies in what you ignore. You must ignore an RSI "oversold" signal when the EMA is pointing sharply down; this is a trap for retail traders. Instead, wait for the trend to stabilize. Professionals also use Bollinger Band "walks" to stay in winning trades. If price is hugging the upper band during a strong trend, don't exit just because an oscillator says the market is overbought. You must use the ATR to adjust position size dynamically based on 2026 volatility to ensure your risk exposure remains consistent across changing market regimes. Combining technical indicators effectively means letting your trend filter override your momentum signals when the market is in a sustained run.
Optimizing Your System for Execution Speed
A flawless technical setup is only half the battle. In the high-velocity markets of 2026, a perfect indicator signal is useless without institutional-grade execution. You've done the heavy lifting of combining technical indicators effectively, but your ultimate profitability depends on the speed of your fill. If your broker lags, your entry point is already history. Professional traders don't just pick indicators; they pick infrastructure that matches their strategy speed. You need a partner that values your time as much as your capital.
Account selection is critical to your success. A Pro Account provides the stability and deep liquidity required for day and swing strategies. However, if your strategy relies on fast-moving momentum indicators or tight volatility breakouts, you need the specialized environment of a Scalp Account. Spreads and slippage act as a hidden tax on your indicator-based entries. Even a micro-delay can turn a high-probability RSI bounce into a break-even trade. To stay ahead of the curve, leverage Social Trading. This allows you to observe in real-time how elite market leaders synchronize their technical toolkits to navigate volatile price action with absolute precision.
Scalping Strategies: High-Speed Indicator Synergy
Scalping demands a different breed of precision. When you're using 5-minute charts, every millisecond counts toward your bottom line. Combine these tight timeframes with the Scalp Account to ensure zero-latency execution on every move. Fast Stochastics and other leading indicators require tighter, more aggressive settings for high-frequency trading. You aren't looking for long-term trends here. You're hunting for momentary imbalances in the order flow. Managing risk becomes paramount when indicators move faster than human reaction time. You need a platform that executes your stops with the same ferocity as your entries.
Institutional Tools for Retail Traders
Indicator lag is often a symptom of poor price feeds, not the indicator itself. TradingPRO provides the elite infrastructure necessary to prevent the data bottlenecks that plague inferior platforms. By accessing premium data feeds, you ensure your indicators reflect the true market state in real-time. This level of accuracy is what separates the veterans from the noise. If you're still building your foundational knowledge, consult our Forex Trading for Beginners Guide to master the basics before deploying complex setups. Ready to put your synergy to the test? Register your professional account and secure your execution edge now.
Executing with Precision: Start Your Journey on TradingPRO
Theory is the foundation, but execution is the architect of your success. You've mastered the pillars and the "Power of Three" rule. Now, you must move from the whiteboard to the live market. This transition requires a controlled environment where you can test your logic without unnecessary risk. Master the art of combining technical indicators effectively by deploying your strategy on a platform built for institutional-grade clarity. Your journey starts with a system that prioritizes precision over noise. Elite traders don't gamble; they execute with intent.
The Rookie Account serves as the ultimate sandbox. It's the perfect testing ground for refining indicator synergy. Here, you can observe how your chosen trio of tools interacts with real-time price action without the pressure of high-stakes capital. Before you scale to our high-performance tiers, run your setup through this final checklist:
- Categorization: Does each indicator represent a different pillar, such as trend, momentum, and volatility?
- Redundancy Check: Are your tools providing unique, non-correlated data to avoid the noise trap?
- Execution Speed: Is your account type optimized for your strategy's specific timeframe?
If you can't tick every box, your edge isn't ready. Precision is non-negotiable in 2026. By combining technical indicators effectively, you've built a system that filters out the retail noise. TradingPRO provides the infrastructure to turn that logic into realized gains. Our platform is designed for those who demand peak performance. It's time to stop theorizing and start dominating the charts.
Your 5-Minute Setup Guide
Getting started is a matter of minutes. Follow these steps to deploy your setup and secure your edge:
- Step 1: Open your Rookie Account to access the full suite of TradingPRO tools and account features.
- Step 2: Select your three non-correlated indicators within the Trade Hub. Ensure you have one trend, one momentum, and one volatility or volume tool for a complete market view.
- Step 3: Execute your first trade with confidence. We provide Negative Balance Protection to ensure your risk is strictly managed as you master your new system.
The Path to Professionalism
Your growth doesn't stop at the sandbox. As your indicator system proves its profitability, you can scale seamlessly from Rookie to Pro or Scalp tiers. This isn't just about trading; it's about joining an elite global ecosystem. Join our partner network to connect with other market leaders and refine your edge through shared expertise. The tools are ready. The infrastructure is global. You've got the logic; now take the lead. Register your account now and master indicator synergy today.
Secure Your 2026 Trading Edge
The difference between a cluttered chart and a professional execution matrix is intentionality. You've learned to bypass the noise trap by categorizing your toolkit and adhering to the "Power of Three" rule. Mastering the art of combining technical indicators effectively is the definitive line between retail hesitation and institutional-grade clarity. You now possess the blueprint to filter false signals and time your entries with surgical precision. It's time to stop theorizing. Start dominating the global markets with a setup that scales as fast as you do.
TradingPRO provides the high-performance environment your strategy deserves. Benefit from our multi-tier account infrastructure and institutional-grade execution speeds that ensure your signals are never wasted. Protect your capital with Negative Balance Protection while you refine your edge in a secure, tech-forward space. The markets wait for no one. Take control of your financial momentum and deploy your synergistic system today. Success is a choice made through superior preparation and elite tools.
Register at TradingPRO and Build Your High-Performance Strategy
Your path to elite status is open. Trust your logic. Follow your framework. Execute with the absolute confidence of a market leader. We're ready for your success.
Frequently Asked Questions
What are the best 3 indicators to use together?
The most effective combination includes one trend indicator like a 200-period EMA, one momentum oscillator such as the RSI, and one volatility tool like Bollinger Bands. This "Power of Three" setup ensures you cover different market dimensions without creating data redundancy. This specific trio allows you to identify the trend, time your entry, and manage your risk with institutional-grade clarity.
Can I use too many technical indicators?
Yes, adding too many indicators creates the "Noise Trap" and leads to analysis paralysis. When you stack five or six tools, they inevitably produce conflicting signals that freeze your decision-making. Elite traders prioritize a clean, non-redundant chart to maintain high execution speeds. Limit your setup to three non-correlated tools to ensure you can act decisively when a high-probability opportunity appears.
Do indicators work on all timeframes?
Technical indicators are fractal and function across every timeframe from 1-minute scalping to monthly position trading. The core math remains the same, but you must adjust the settings to match market volatility. Shorter timeframes require more sensitive settings to filter intraday noise. Higher timeframes generally offer more reliable signals because they represent a larger consensus of institutional capital movement.
Should I use the same indicators for Forex and Commodities?
You can use the same indicators, but you must calibrate them for the specific volatility of the asset class. Forex pairs often trend more smoothly, while commodities like Gold or Oil are prone to aggressive, news-driven spikes. Adjust your Average True Range settings to account for these differences. Combining technical indicators effectively requires you to respect the unique personality of every instrument you trade.
What is the difference between leading and lagging indicators?
Lagging indicators like Moving Averages confirm a trend that is already in progress; leading indicators like the Stochastic Oscillator attempt to predict price reversals before they happen. A professional strategy uses both to create a complete market view. Lagging tools provide the directional bias, while leading tools act as the trigger for your specific entry and exit points.
How do I avoid conflicting signals from indicators?
Avoid conflicts by combining technical indicators effectively from non-correlated categories rather than stacking similar tools. Establish a clear hierarchy where your trend indicator always dictates the trade direction. If your trend filter is bullish but your momentum oscillator is overbought, you simply wait for a pullback. This disciplined approach ensures you only execute when all pillars of your strategy align.
Is technical analysis still effective in 2026?
Technical analysis remains the definitive way to track institutional footprints and algorithmic order flow in 2026. While the elimination of the Pattern Day Trader rule has increased retail participation, the core mechanics of supply and demand haven't changed. Success now depends on using sophisticated infrastructure to execute your technical signals faster than the competition. Precision and speed are the new requirements for profitability.
Do I need a high-speed account to use momentum indicators effectively?
Fast-twitch momentum strategies require the institutional-grade execution of a Scalp Account to be profitable. Momentum indicators often signal entries that last for only a few minutes; any delay in execution results in slippage that eats your margin. If your strategy relies on capturing quick bursts of price action, your account infrastructure must be as fast as your indicators to ensure high-precision fills.


