




- Published on: 2026-07-27 10:10:43
Mastering Chart Patterns: The 2026 Guide to Visual Market Dominance

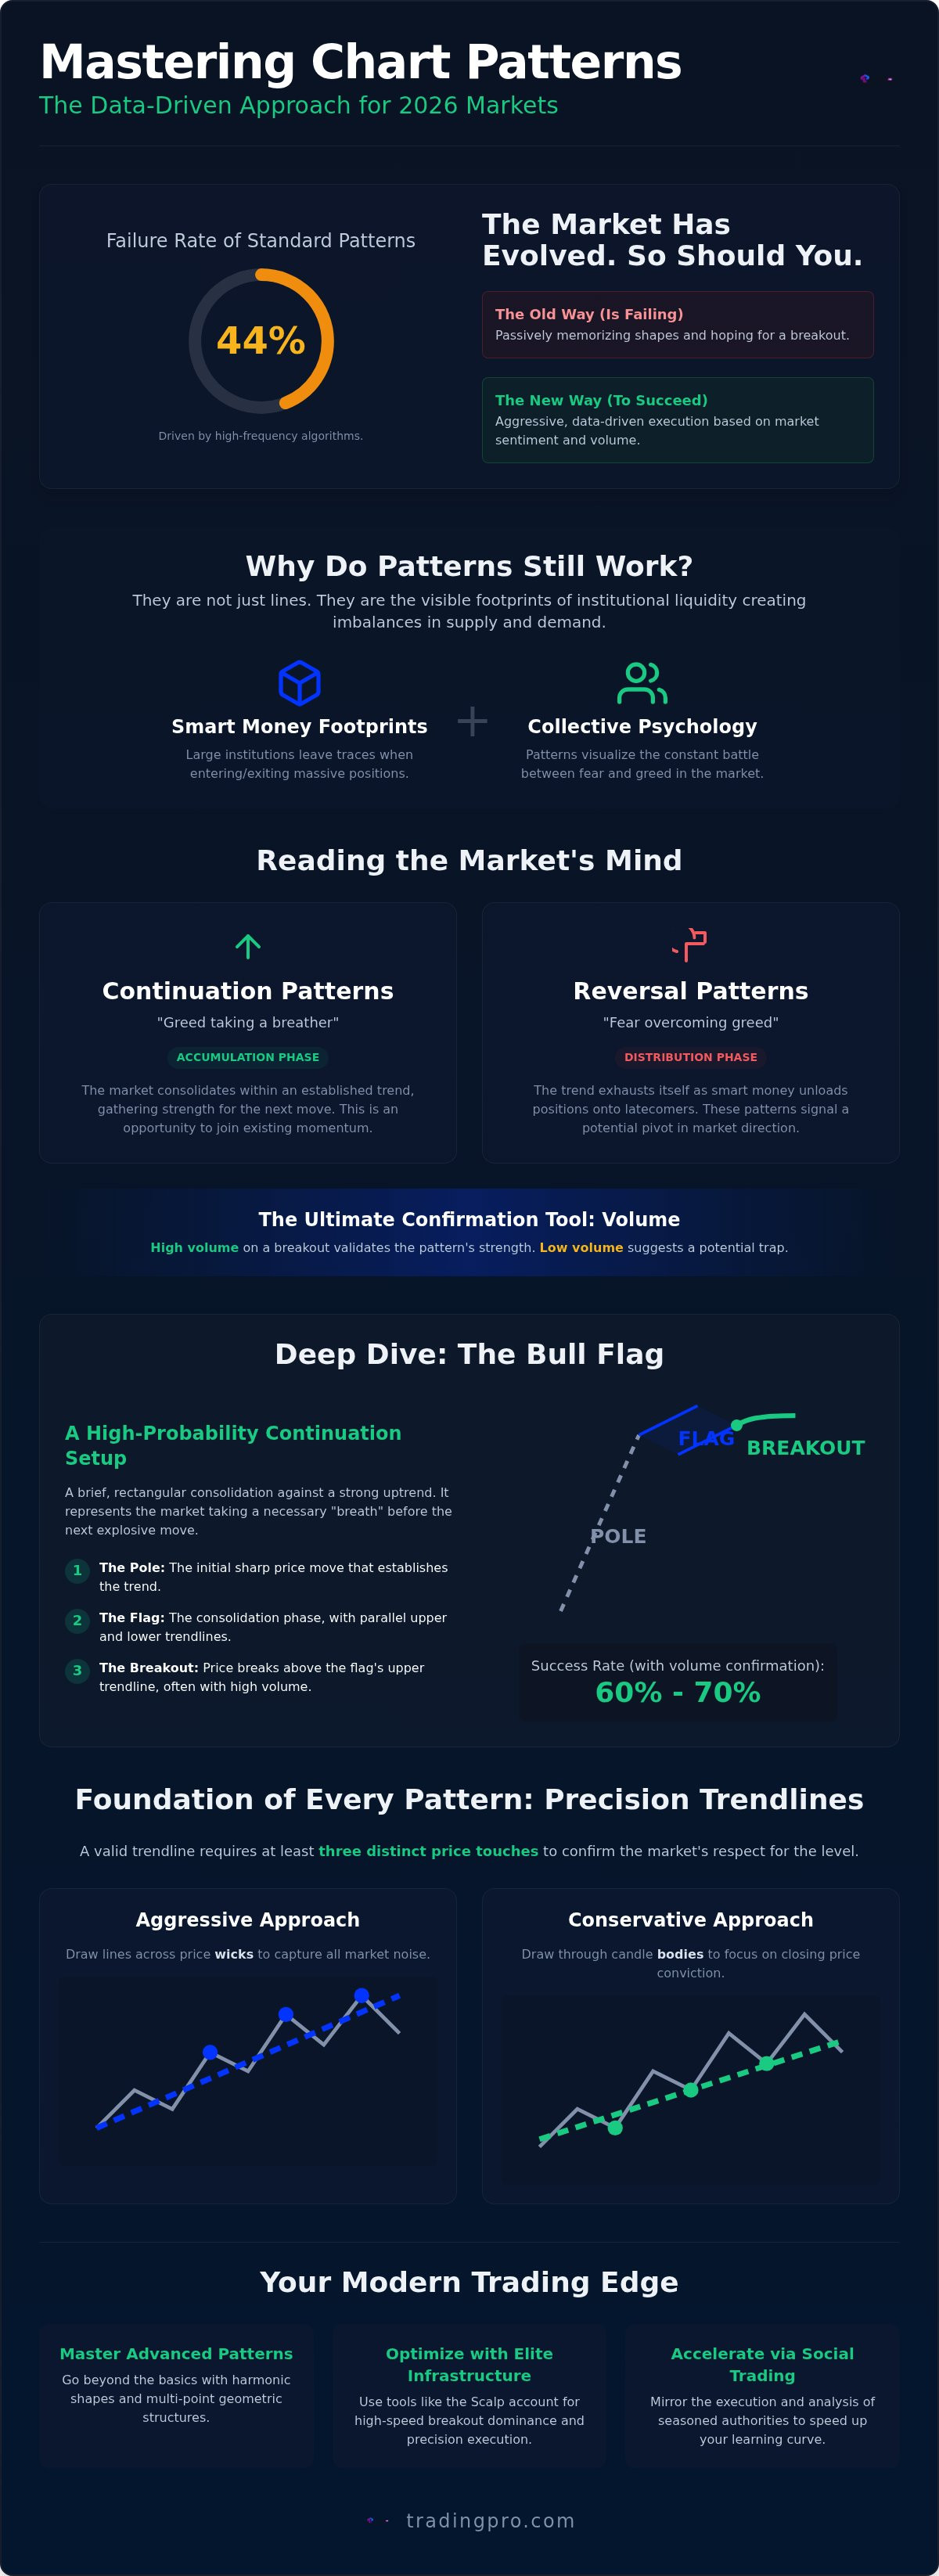
Did you know that the failure rate for standard chart patterns has climbed as high as 44% since the rise of high-frequency algorithms? It's a brutal reality that many retail traders face every day. You've likely experienced the sting of a "perfect" breakout that reverses the moment you click buy. Simply memorizing shapes is no longer a viable strategy for success. Mastering chart patterns in 2026 requires a shift from passive observation to aggressive, data-driven execution. You need to read the underlying sentiment of the market rather than just drawing lines on a screen.
We understand the frustration of being overwhelmed by endless patterns while struggling to manage risk during high volatility. This guide promises to unlock your ability to identify high-probability setups and execute them with the precision of an institutional desk. We'll show you how to combine classic visual signals with modern volume and momentum indicators to filter out the noise. From leveraging the newly unrestricted freedom of the post-PDT rule environment to utilizing elite tools like the Scalp account for rapid-fire breakouts, you're about to build a systematic approach that turns visual data into consistent profit.
Key Takeaways
- Decode the psychological shifts in market sentiment by identifying how institutional liquidity forms recognizable price structures.
- Prioritize continuation setups to ride existing momentum, or use divergence signals to catch trend reversals before they become obvious to the crowd.
- Elevate your technical analysis by mastering chart patterns like harmonic shapes and multi-point geometric structures for a superior edge.
- Optimize your results by matching pattern strategies to elite infrastructure, using the Scalp account for high-speed breakout dominance.
- Accelerate your growth through Social Trading to mirror the execution precision of seasoned authorities in the field.
The Blueprint of Price Action: Why Chart Patterns Still Work in 2026
The global markets are a relentless battleground of human emotion and institutional force. Even in 2026, where high-frequency algorithms execute in microseconds, the core driver of price remains unchanged: collective psychology. To understand What are chart patterns? is to realize they are not just geometric shapes on a screen. They are visual maps of supply and demand imbalances. When you focus on mastering chart patterns, you aren't just looking for triangles or rectangles. You're hunting for the footprints of institutional liquidity.
Major financial institutions and hedge funds cannot enter or exit massive positions without leaving a trace. Their orders create the support and resistance levels that eventually form recognizable structures. While AI systems now dominate the execution layer, they still operate within the constraints of available liquidity. This creates structural imbalances that retail traders can exploit. Patterns work because they represent the "path of least resistance" for price. They are more than self-fulfilling prophecies; they are the result of smart money positioning itself before a major move.
The Psychology Behind the Shapes
Every pattern tells a high-stakes story of a tug-of-war. Reversal patterns represent the exact moment fear overcomes greed. The trend exhausts itself. Smart money begins the distribution phase, unloading positions to late-coming retail traders. Conversely, continuation patterns signal a period of greed taking a breather. This is the accumulation phase. Professional traders use volume as their primary confirmation tool. High volume on a breakout validates the pattern's strength. Low volume suggests a potential trap designed to hunt your stop losses.
Trendlines: The Foundation of Every Pattern
Precision starts with your foundation. In 2026, market volatility has expanded, making sloppy trendlines an expensive liability. You must choose your approach with conviction. Aggressive traders draw lines across price wicks to capture every bit of market noise. Conservative traders prefer drawing through candle bodies to focus on the closing price conviction. Your choice should align with your specific trading goals and the execution speed of your chosen environment. A valid trendline is defined by at least three distinct price touches that confirm the market's respect for the diagonal level.
Success in mastering chart patterns requires more than a keen eye. It demands an elite infrastructure that can keep pace with 2026 market speeds. Whether you are using the Trade Hub for deep analysis or monitoring institutional flow, your goal is to identify these blueprints before the crowd reacts. You aren't just trading lines; you're trading the conviction of the world's most powerful market participants.
Continuation Patterns: Riding the Momentum with Precision
Momentum is the lifeblood of high-performance trading. Continuation patterns aren't just geometric shapes; they are the market taking a necessary breather before the next explosive move. For those focused on mastering chart patterns, these setups offer a distinct advantage: they occurs within established trends. This reduces the risk of "catching a falling knife" or fighting the tape. You're simply waiting for the trend to refuel. One critical element is the "pole," the initial sharp price move leading into the pattern. This vertical distance provides a mathematical blueprint for your next profit target. By utilizing Trade Hub tools, you can monitor real-time momentum shifts to ensure you aren't entering a trend that has already exhausted its fuel.
Pennants and Flags: Identifying the Market Breath
In the fast-moving FX markets of 2026, flags and pennants are your most reliable allies. A flag is a brief, rectangular consolidation against the trend, while a pennant looks like a small symmetrical triangle. The distinction is subtle, but the execution must be flawless. Aggressive traders buy the immediate breakout of the upper boundary. Conservative traders wait for a retest of the consolidation zone to confirm the new support level. Always set your stop-loss just below the "swing low" of the flag formation. This protects your capital if the "breather" turns into a full reversal. Verified data shows that bull flags often complete 60% to 70% of the time when confirmed with high volume, making them a staple for institutional-grade portfolios.
Triangles and Wedges: Timing the Breakout
Triangles represent a tightening of price action where supply and demand reach a temporary equilibrium. They require patience and precise timing to trade effectively. Consider these three primary structures:
- Ascending Triangles: Higher lows meet a flat resistance level, signaling building bullish pressure.
- Descending Triangles: Lower highs meet flat support, typically indicating a bearish breakdown.
- Symmetrical Triangles: Neutral structures where a breakout in either direction is possible.
The "Apex" rule is vital here. If the price doesn't break out before reaching 75% of the distance to the triangle's apex, the pattern often loses its predictive power and becomes a choppy range. To avoid the "fakeout," many professionals use a 2% price filter or demand a full candle close outside the boundary. Applying these trading strategies for chart patterns ensures you aren't trapped by algorithmic stop-hunts that target retail liquidity.
Execution speed is the final piece of the puzzle. When the triangle snaps, the move is often violent and swift. Mastering chart patterns is useless if your platform lags during the critical breakout moment. If you're ready to put these high-probability setups to work with professional-grade tools, you can open your account today to access the execution speeds required for momentum dominance.
Reversal Patterns: Catching the Pivot Before the Crowd
Identifying the exact moment a trend exhausts itself is the hallmark of an elite trader. Reversal patterns signal these critical exhaustion points where major moves lose steam and the "smart money" begins to exit. Unlike continuation setups, reversals require a higher degree of patience and multiple layers of confirmation. You aren't just riding a wave; you're betting that the tide is about to turn. Mastering chart patterns in this category means looking for "Divergence" as your primary filter. When price makes a new high but momentum indicators like the RSI fail to follow, the visual pattern gains institutional-grade weight. It's the market's way of showing you the underlying weakness before the price actually snaps.
Because these setups involve fighting the prevailing trend, the risk of a "fakeout" is higher. Professional traders often use a Rookie Account to practice identifying these long-term pivots in a controlled environment. This allows you to build the discipline needed to wait for a confirmed break of structure rather than trying to pick the absolute top or bottom. Remember, a reversal isn't valid until the previous trend's support or resistance is decisively shattered.
Head and Shoulders: The Classic Trend Killer
The Head and Shoulders pattern is widely considered the most reliable reversal structure in technical analysis. It consists of a left shoulder, a higher head, and a right shoulder that fails to exceed the head's peak. The "neckline" connects the two intervening lows and serves as the ultimate trigger. Research indicates that this pattern can have a success rate of up to 89% once the neckline is confirmed. You can calculate a precise price target by measuring the vertical distance from the head to the neckline and projecting that same distance downward from the breakout point. In bear markets, look for the Inverted Head and Shoulders to identify high-probability bottoming signals.
Double Tops and Bottoms: Identifying Exhaustion
Double tops and bottoms are visual representations of the market's inability to push past a specific price level. However, many retail traders fall into the "Triple Top" trap by entering too early. To avoid this, always check for waning momentum at the second peak using the RSI. According to Fidelity's Guide to Chart Patterns, these structures are most effective when they follow a prolonged trend. You have two primary execution options: the "Aggressive Peak" entry for higher risk-reward or the "Neckline Break" entry for institutional-grade confirmation. Mastering chart patterns requires knowing which entry matches your current risk profile and account environment.
Advanced Pattern Analysis: Geometric and Harmonic Shapes
Elite traders don't stop at basic triangles. They move into the realm of complex geometric structures that reveal the deeper layers of market intent. Mastering chart patterns at this advanced level requires a deep understanding of multi-point price action and mathematical precision. These structures aren't just shapes; they're blueprints of high-conviction institutional moves. Because these patterns often trigger explosive volatility, they require the ultra-low latency and high-speed execution of a ScalpX Account. When a geometric setup matures, every millisecond of execution speed directly impacts your bottom line.
Cup and Handle: The Bullish Accumulation Signal
The Cup and Handle is a premier signal of long-term bullish accumulation. It begins with a "U-shaped" recovery that shows a steady transition from selling pressure to buying conviction. You must be cautious of "V-shaped" cups. A sharp, narrow recovery often lacks the structural integrity of a rounded base and is a warning sign of potential failure. The subsequent "Handle" is a brief period of consolidation that shakes out weak hands before the final breakout. To validate the move, look for a significant drop in volume during the handle and a massive surge in volume as the price clears the resistance line. This volume profile confirms that big players are stepping in to drive the next leg higher.
The Harmonic Edge: Gartley and Butterfly Basics
Harmonic patterns take technical analysis to a sophisticated, institutional level. Unlike traditional shapes, harmonics use the XABCD structure, which involves five specific pivot points. These patterns rely on the mathematical harmony of the market. You'll focus on the 0.618 and 0.786 Fibonacci levels to validate the Gartley and Butterfly structures. If the price doesn't hit these ratios with precision, the pattern is invalid. Harmonic patterns are considered predictive rather than reactive because they utilize specific Fibonacci ratios to identify potential reversal zones before the price action actually pivots. This allows you to set orders at the "Potential Reversal Zone" (PRZ) with extreme confidence.
Success with advanced geometry demands a platform that matches your ambition. You need institutional-grade tools to identify these multi-point structures before the retail crowd catches on. If you're ready to execute these high-probability setups with the precision of a global leader, register your Pro account now and dominate the 2026 markets.
Executing with Edge: Integrating Patterns with TradingPRO Infrastructure
Visual mastery of the markets means nothing without the elite infrastructure to back it up. Execution speed is the hidden variable that separates a profitable breakout from a devastating slippage event. When mastering chart patterns, you must ensure your platform can handle the surge in liquidity that accompanies a confirmed signal. TradingPRO provides the multi-tiered environment required to bridge the gap between technical theory and institutional-grade execution. You've learned to read the sentiment; now you must execute with the precision of a global leader.
Before you hit "Execute" on any setup in 2026, run through this final validation checklist to ensure structural dominance:
- Volume Confirmation: Does the breakout show a verified surge in institutional liquidity?
- Momentum Alignment: Do your oscillators support the direction of the visual price structure?
- Timeframe Synergy: Is the pattern visible across multiple timeframes to confirm trend strength?
- Infrastructure Match: Is your account tier optimized for the speed and spread requirements of this specific setup?
Choosing Your Arena: Rookie vs. ScalpX
Choose your arena with purpose. The Rookie Account serves as an elite environment for swing traders. It's perfectly suited for identifying daily reversal patterns where the goal is capturing multi-day pivots with institutional stability. If your strategy involves high-frequency, 1-minute flag and pennant breakouts, the ScalpX Account is your primary weapon. This environment leverages ultra-low latency technology to ensure you enter at the exact moment the pattern snaps. Zero-spread environments protect your profit margins on small, rapid-fire patterns where every pip counts toward your competitive advantage.
The Social Shortcut: Copying Pattern Masters
You don't have to hunt every setup alone. Social Trading allows you to filter a global ecosystem for experts with high "Technical Analysis" scores. These professionals have already refined the art of mastering chart patterns across diverse market conditions. Use Copy Trading as a live educational tool. It allows you to observe how seasoned authorities manage risk during high volatility and where they place their exits. This is the ultimate shortcut to success. Always employ strict risk management settings within the social feed to protect your equity during pattern failures. By mirroring elite execution, you accelerate your journey toward visual market dominance.
Seize Your Competitive Advantage in the 2026 Markets
The market doesn't reward hesitation. It rewards the precision of those who can decode visual sentiment and act with total conviction. You've moved beyond basic shapes to understand the deep psychological blueprint of price action. Whether you're riding momentum with bull flags or catching pivots with harmonic structures, your edge is now defined by your ability to synthesize data into actionable profit. Mastering chart patterns in 2026 is the baseline for anyone seeking institutional-grade results.
True dominance requires more than knowledge; it demands an elite environment. TradingPRO provides the global multi-asset infrastructure you need to execute every setup with confidence. From the high-speed execution of the ScalpX account to the stable swing-trading focus of the Rookie account, we provide tailored environments for every strategy. Master patterns with a TradingPRO account today and leverage institutional-grade execution speed to secure your place at the top. The opportunity is yours to claim. Step into the arena as a seasoned authority and build your legacy.
Frequently Asked Questions
What is the most reliable chart pattern for beginners?
The Head and Shoulders pattern is widely considered the most reliable setup for those starting their journey in mastering chart patterns. Its clear structure of three peaks and a definitive neckline provides an objective entry point with high historical success rates. Beginners should focus on this pattern because it offers a distinct mathematical target and a clear level for stop-loss placement, reducing the emotional guesswork often found in more complex geometric shapes.
How do I distinguish a real breakout from a fakeout?
Volume is your primary filter for identifying legitimate breakouts. A true breakout must be accompanied by a significant surge in trading volume, signaling institutional participation. You should also wait for a decisive candle close above the resistance level rather than entering on a mid-candle spike. Using a price filter, such as a 2% move beyond the boundary, can further protect you from algorithmic stop-hunts designed to trap retail liquidity during high volatility.
Do chart patterns work on all timeframes, from 1-minute to daily?
Chart patterns are fractal, meaning they appear on every timeframe from 1-minute scalping charts to monthly investment views. While the shapes remain the same, reliability often increases on higher timeframes due to the larger volume of data involved. Scalpers using the Scalp account frequently trade 1-minute flags for rapid gains. Conversely, swing traders on the Rookie account prioritize daily reversal patterns to capture major structural shifts in market sentiment with institutional stability.
Can I use AI or automated tools to identify chart patterns?
Integrating AI into your technical analysis is a standard practice in 2026. Specialized software and mobile apps now feature "Ask-AI" functions that scan thousands of assets to detect emerging structures instantly. These tools provide a massive efficiency boost, allowing you to focus on execution rather than manual scanning. However, you must always verify these automated detections against volume and momentum indicators to ensure they align with the current market context and institutional flow.
How many times should a price touch a trendline for a pattern to be valid?
A trendline requires exactly three distinct price touches to be considered valid and reliable. Two touches merely suggest a potential level, but the third touch confirms that the market respects the diagonal boundary. When mastering chart patterns, drawing your lines through at least three points ensures you aren't trading a random price fluctuation. This third touch provides the structural integrity needed to set high-conviction trades with the precision required for global market dominance.
What is the difference between a continuation and a reversal pattern?
The primary difference lies in the expected direction of the price following the breakout. Continuation patterns, like flags and pennants, signal that the market is taking a brief pause before resuming the existing trend. Reversal patterns, such as double tops or head and shoulders, indicate that the current trend has exhausted its momentum and is likely to pivot in the opposite direction. Identifying this distinction is critical for proper risk management and setting accurate profit targets.
Why do some chart patterns fail even when they look perfect?
Perfect-looking patterns often fail because of increased market efficiency and the prevalence of high-frequency trading algorithms. These systems are programmed to identify textbook setups and exploit the concentrated liquidity of retail stop-losses placed at obvious levels. Research shows that some patterns now face failure rates as high as 44%. Success requires looking beyond the shape to confirm the move with volume, momentum, and the broader economic context provided by elite infrastructure.
How do I set a price target once a chart pattern breaks out?
You calculate a price target by using the "measured move" technique specific to each pattern. For a flag, measure the vertical distance of the preceding "pole" and project it from the breakout point. For a head and shoulders, measure the distance from the head to the neckline and apply that same distance downward. These mathematical targets provide a disciplined exit strategy, ensuring you capture the bulk of the move without falling victim to greed or hesitation.


