




- Published on: 2026-07-30 10:01:11
RSI Indicator Trading Strategy: Master Momentum and Execution in 2026

Most traders use the RSI to hunt for reversals, but in 2026, that is exactly why they are losing money. The Relative Strength Index is not a buy the dip button. It is a high-octane momentum engine designed to confirm strength before the market leaves you behind. If you've struggled with whipsaws in trending markets or watched your entries lag while the move happens without you, you're not alone. The elimination of the Pattern Day Trader rule in June 2026 has opened the floodgates for retail volatility. This makes precision and speed more critical than ever before.
You likely feel the frustration of a signal that looks perfect on the chart but fails the moment you click trade. We agree that emotional hesitation during high volatility can cost you the meat of the move. This guide promises to transform your approach by turning a basic oscillator into a professional RSI indicator trading strategy. You'll learn how to filter signals like an institutional pro and execute with the speed required to dominate today's fast-paced environment. We'll cover everything from momentum mechanics to the elite infrastructure that supports high-frequency execution and professional growth.
Key Takeaways
- Shift your perspective from reversal hunting to momentum acceleration. Learn why the 70/30 overbought fallacy often hides the most profitable trend moves.
- Master professional entry signals with regular and hidden divergence. Spot market exhaustion and trend discounts with surgical precision before the crowd reacts.
- Optimize your RSI indicator trading strategy by integrating MACD and multi-timeframe analysis. Build a dual-confirmation engine that filters out market noise.
- Secure your competitive edge with institutional-grade execution. Discover how Scalp Account infrastructure eliminates latency to capture high-stakes momentum shifts.
- Scale your success through the Social Trading ecosystem. Transition from manual execution to passive strategy replication and follow elite traders in real time.
Beyond the 70/30 Trap: Why Most RSI Strategies Fail
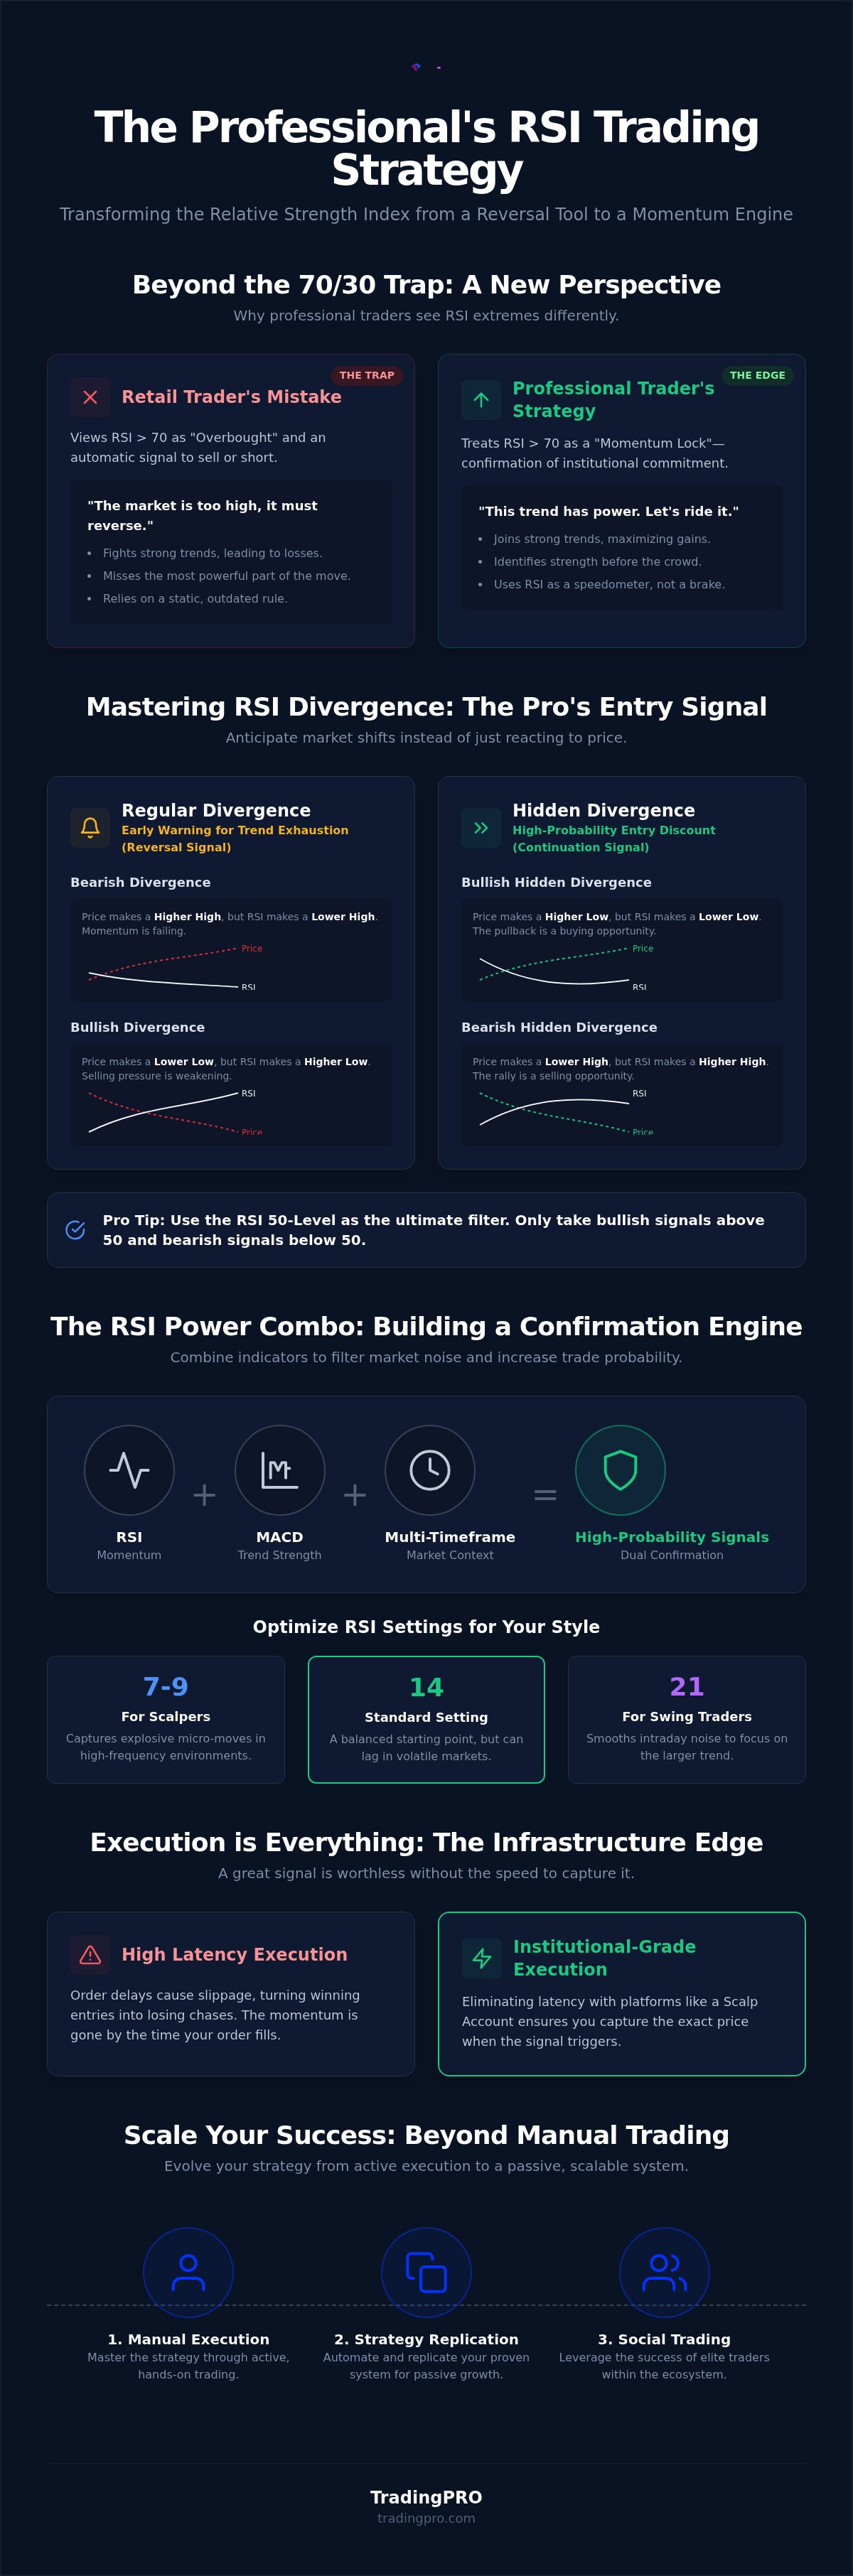
The Relative Strength Index (RSI) is a momentum oscillator that measures the speed and change of price movements. While retail traders treat the 70 and 30 levels like immovable barriers, professional desks view them as launchpads. The biggest mistake you can make is assuming that "overbought" means "time to sell." In a high-velocity market, an asset hitting the 70 mark isn't necessarily a signal to fade the move; it's often a confirmation that the trend has finally found its rhythm. If you've been stopped out while trying to short a market that just keeps climbing, you've fallen into the 70/30 trap.
A sophisticated RSI indicator trading strategy treats the index as a momentum accelerator. Think of it as a speedometer rather than a thermometer. When price action accelerates, the RSI moves into extreme zones to reflect that power. Success in 2026 requires you to understand market context. For instance, price behavior in the Philippines often exhibits different volatility cycles compared to global FX majors like EUR/USD or USD/JPY. Global majors might respect traditional levels during ranging sessions, but trending assets will shatter those boundaries without looking back. You need a system that adapts to the environment instead of relying on static rules from a textbook.
The RSI Formula vs. Market Reality
The standard 14-period setting is a relic of slower trading eras. In today's high-frequency landscape, relying on lagging data is a recipe for disaster. Scalpers often tighten their lookback period to 7 or 9 to capture explosive micro-moves before they're gone. Conversely, swing traders might expand to 21 periods to smooth out the noise of intraday volatility. Precision is the goal. When the RSI enters an extreme zone, execution speed becomes your most valuable asset. Even a minor delay in your order entry can turn a winning momentum play into a losing chase.
Identifying the 'Momentum Lock'
The "Momentum Lock" occurs when the RSI stays pinned above 70 during a bullish surge or below 30 during a crash. This isn't market exhaustion; it's institutional commitment. To master this, you must learn to avoid shorting into a bullish lock. Instead of guessing the top, use the TradingPRO Trade Hub to cross-reference RSI extremes with real-time volume data. When high volume accompanies an RSI pinned in the extreme zone, it confirms that the momentum is locked in. This is your signal to stay with the trend and ride the move until the strength actually begins to dissipate.
Mastering RSI Divergence: The Professional’s Entry Signal
Divergence is the ultimate weapon for traders who want to stop guessing and start anticipating. While the crowd reacts to what price did five minutes ago, Mastering RSI Divergence allows you to see the internal decay or acceleration of a move before it becomes obvious on the chart. In a high-performance RSI indicator trading strategy, divergence isn't just a pretty pattern. It's a clear signal of institutional order flow shifting. Regular divergence acts as your early warning system for market exhaustion, signaling that the current trend is losing its grip. When price hits a higher high but the RSI produces a lower high, the momentum engine is stalling.
Hidden divergence is the professional's secret for entering established trends on a massive discount. Unlike regular divergence, which hunts for reversals, hidden divergence confirms trend continuation. Imagine price making a higher low while the RSI makes a lower low. This suggests that the bears tried to push the oscillator down, but price refused to follow, creating a coiled spring effect. To filter these signals with institutional precision, always use the 50-level crossover. The midpoint is the line in the sand; bulls dominate the upper half, while bears own the bottom. Never pull the trigger on a bullish setup if the RSI is still struggling below the 50-mark.
Bullish vs. Bearish Divergence Patterns
Success requires grading your setups. Class A divergence, where price and RSI move in sharply opposite directions, offers the highest probability. Class B and C setups are more subtle and require tighter risk management. When you spot a valid divergence, set your stop-loss just beyond the recent swing high or low. This protects your capital if the momentum lock mentioned in the previous section persists. For those still refining their technical foundation, our Forex trading for beginners guide provides the essential context for managing these high-stakes entries.
Filtering Fake Divergences with Price Action
The RSI can remain divergent for a long time in a trending market, leading to painful "fake-outs." You must wait for a break in market structure to confirm the indicator's hint. Look for an RSI "Double Top" in the overbought zone or a "Swing Rejection" where the indicator fails to make a new extreme and breaks its own support line. This physical confirmation ensures you aren't just fighting a strong trend. Ready to put these professional signals to work? Register your account and start executing with the precision of a market leader.
Use this checklist for every setup:
- Identify the dominant trend on a higher timeframe.
- Locate the mismatch between price peaks/troughs and RSI peaks/troughs.
- Verify that the RSI has crossed the 50-level midpoint.
- Wait for a price action trigger, like a candle engulfing or a structure break.
The RSI Power Combo: Integrating MACD and Multi-Timeframe Analysis
Stop relying on a single indicator to do the heavy lifting. Elite performance in 2026 demands a multi-layered approach that filters market noise and confirms institutional intent. While the RSI measures momentum speed, the Moving Average Convergence Divergence (MACD) tracks the underlying trend direction. Pairing these two creates a "Dual Confirmation" engine that prevents you from entering "overbought" signals during a massive trend surge. This integrated RSI indicator trading strategy is the gold standard for Rookie Account users because it provides a definitive "if-then" framework. It removes the emotional guesswork that leads to premature exits and blown accounts.
The synergy between these tools is simple but lethal. The RSI tells you if the current move is overextended, while the MACD confirms if the trend has the structural support to continue. By waiting for both to align, you ensure you're only trading high-probability setups where momentum and trend are in sync. This isn't just about finding entries; it's about building a repeatable system that scales as your capital grows. Precision execution starts with a clear bias, and a multi-timeframe approach is the only way to achieve it.
Setting Up the RSI + MACD Dashboard
To handle 2026 market volatility, use the standard 14-period RSI alongside the classic 12, 26, 9 MACD settings. Your "Sweet Spot" occurs when the MACD histogram flips across the zero line at the exact moment the RSI crosses its 50-level midpoint. This confluence signals a massive shift in market control. Before you execute, always consult a Forex profit calculator to verify your position size. Managing your risk-to-reward ratio is just as important as the signal itself. Never trade blindly without knowing your exact exit points.
Multi-Timeframe Alignment Strategy
Success requires a top-down perspective. Start by identifying the "Power Trend" on the H4 or Daily chart; look for an RSI value consistently above 60 for bullish bias or below 40 for bearish bias. Once the bias is set, drop down to the 15-minute (M15) chart. Wait for a short-term "oversold" dip where the M15 RSI drops below 30 within that larger bullish trend. This allows you to buy the dip with surgical precision. By aligning the micro-move with the macro-trend, you maximize your profit potential while keeping your stop-losses incredibly tight. This is how professional desks dominate the landscape.
- Step 1: Confirm Daily/H4 bias (RSI > 60 for longs).
- Step 2: Monitor M15 for a counter-trend dip (RSI < 30).
- Step 3: Wait for MACD histogram reversal on M15.
- Step 4: Execute with confidence and clear risk parameters.
Execution Strategy: Why ScalpX Infrastructure Wins with RSI
A flawless RSI indicator trading strategy is only as good as the pipes it runs through. In the high-stakes environment of 2026, the difference between 10ms and 100ms latency isn't just a technical detail. It's the difference between catching a massive momentum surge and buying the exhausted exit of an institutional whale. When the RSI hits an extreme zone above 80 or below 20, price action often moves with violent speed. If your broker's execution lags, you're entering at a price that no longer exists. This is why institutional-grade infrastructure is no longer optional for retail traders who want to win.
TradingPRO empowers your technical strategy with the Scalp Account. This infrastructure is purpose-built for zero-spread efficiency and rapid-fire execution. High-octane trading requires managing slippage during RSI-driven breakout trades where every pip counts. Our ecosystem minimizes the gap between your intended trigger and the actual fill. This ensures your entry matches the momentum signal you identified on the chart. Don't let inferior technology dilute your edge; use the tools designed for peak performance.
Scalping the RSI: High-Frequency Tactics
Ultra-fast market moves require ultra-fast settings. Switch to a 5-period RSI to identify micro-exhaustion points on the 1-minute chart. This setup demands ECN execution to handle the rapid-fire nature of "in-and-out" trades. For a deeper look at the technical specs required for this level of performance, explore our blog for insights on the best trading infrastructure for scalping. Capturing RSI divergence on a 1-minute candle is a feat of precision that only elite infrastructure can support. It's about getting in, taking the meat of the move, and getting out before the market breathes.
Risk Management for High-Octane RSI Trading
Speed without control is a liability. Set automated stop-losses immediately to protect against indicator lag during high-impact news events. Even the most robust RSI indicator trading strategy can be blindsided by sudden volatility. This is where Negative Balance Protection becomes your final safety net. It ensures you never lose more than your account balance, even in the most chaotic market conditions. Use the Trade Hub tools to calculate your position size in seconds. Precision in risk management is just as vital as precision in your entry signal. Ready to execute with institutional power? Register your account today and take control of your momentum.
Scaling Your RSI Strategy: Social Trading and Automation
Scaling a manual RSI indicator trading strategy is the final step toward achieving institutional-level success. While manual precision builds your foundation, the 2026 trading environment rewards those who can replicate success across multiple streams. Transitioning from active execution to passive scaling is now possible through Social Trading. This ecosystem allows you to mirror the trades of veterans who have already mastered the RSI momentum engine. You don't need to be glued to your screens 24/7. Instead, you leverage the expertise of elite performers while maintaining full control over your risk parameters.
True scaling also requires diversification. An RSI signal on Gold behaves differently than one on a major FX pair or a global equity index. By spreading your strategy across diverse asset classes, you reduce the impact of a single market's stagnation. This multi-asset approach ensures that your capital is always working where the momentum is strongest. To support this expansion, the TradingPRO Deposit Bonus provides the additional margin necessary to hold multiple positions without over-leveraging your core balance. It's a strategic tool for traders ready to move from testing to dominant market participation.
Finding an RSI Master to Copy
Success in the social ecosystem starts with rigorous vetting. Don't just follow the highest percentage return. Filter the social feed for low drawdown and long-term consistency. Analyze a provider's discipline by looking at their entry history. Do they chase price when the RSI is already overextended, or do they wait for the precise divergence patterns we've discussed? A true master exhibits patience. Allocate your capital across multiple RSI experts to create a balanced portfolio that survives different market cycles.
Your 2026 RSI Roadmap
The path to mastery is clear and actionable. Follow these steps to secure your position in the market:
- Step 1: Register your Rookie or Scalp account to access institutional-grade execution speed.
- Step 2: Utilize the Trade Hub to master divergence patterns and cross-reference momentum with volume.
- Step 3: Deploy your RSI indicator trading strategy, analyze the performance data, and scale using social replication tools.
This roadmap isn't just a suggestion. It's a blueprint for traders who refuse to settle for retail-level results. The tools are ready. The infrastructure is live. Your execution starts now.
Dominate the Momentum Landscape in 2026
Mastering the market requires more than just reading a chart. It demands a shift from passive observation to aggressive, precision execution. You now have the blueprint to transform a basic oscillator into a high-performance RSI indicator trading strategy that captures the meat of every move. By shattering the 70/30 fallacy and aligning momentum with multi-timeframe confirmation, you've positioned yourself ahead of the retail crowd.
Success in 2026 isn't just about the signal; it's about the infrastructure behind it. Whether you're scalping micro-moves with zero spreads on a Scalp Account or replicating the success of experts through our robust Social Trading ecosystem, the tools for global dominance are at your fingertips. We ensure your capital is secured by Negative Balance Protection, allowing you to pursue ambitious goals with institutional-grade stability. The landscape is moving fast. Don't let hesitation cost you the next major trend.
Execute Your RSI Strategy with Elite Speed—Open a TradingPRO Account Today. Your path to peak performance starts now.
Frequently Asked Questions
Is the RSI indicator reliable for crypto trading in 2026?
The RSI remains highly reliable for crypto in 2026 as it captures the rapid velocity and volatility of digital assets. You must pair it with institutional-grade infrastructure to handle high-frequency shifts. Crypto markets often enter extended momentum locks; therefore, using the RSI to find trend continuation is far more effective than hunting for reversals in a parabolic market.
What is the best RSI setting for day trading forex?
For 2026 day trading, many professionals tighten the RSI to a 7 or 9-period setting to capture micro-momentum. The standard 14-period setting often lags in fast-moving FX markets. Adjusting your settings allows you to enter the meat of the move before the trend exhausts. Always test these settings on a Rookie Account to ensure they align with your specific trading style.
Can I use the RSI indicator alone to make trading decisions?
You should never use the RSI alone to make high-stakes trading decisions. While it provides a powerful momentum gauge, a successful RSI indicator trading strategy requires confluence from volume or trend-following indicators like MACD. Professionals use the RSI as a trigger, but they verify the setup with price action and market structure before committing capital.
What is the difference between RSI and the Stochastic oscillator?
The primary difference lies in their calculation and sensitivity. RSI measures the speed and change of price movements on a scale of 0 to 100. The Stochastic oscillator compares a specific closing price to its range over a certain period. While both are oscillators, RSI is better for measuring trend strength, whereas Stochastics excel in sideways, ranging markets.
How do I avoid fake RSI divergence signals?
Avoiding fake signals requires patience and structural confirmation. Don't pull the trigger just because you see a mismatch between price and the oscillator. Wait for a "Swing Rejection" on the RSI or a definitive break of a recent support or resistance level on the price chart. This ensures the market has actually shifted before you enter a reversal trade.
Does TradingPRO offer a demo account to practice RSI strategies?
TradingPRO provides fully functional demo environments where you can refine your RSI indicator trading strategy without risking capital. Once you've mastered divergence and momentum locks, you can transition to a Rookie or Scalp Account. These accounts offer the institutional execution speeds necessary to turn your theoretical strategy into consistent market performance.
What is a 'Good' RSI number for a buy signal?
A "good" number depends entirely on the market context. In a strong bullish trend, an RSI bounce off the 40 or 50 level is often a high-probability buy signal. Don't wait for the RSI to hit 30 in an uptrend; it rarely happens during the most profitable moves. Instead, look for hidden divergence as a sign of institutional strength.
Why does my RSI stay overbought for so long?
Your RSI stays overbought because the market is in a "Momentum Lock." This happens when institutional buyers are aggressively pushing price higher and refusing to let it pull back. In 2026, an overbought RSI is frequently a sign of a powerful breakout rather than a signal to sell. Stay with the trend until you see a confirmed structural shift.


