




- Published on: 2026-07-28 10:05:20
Support and Resistance Trading Strategy: The 2026 Professional Guide to Market Geometry

Stop treating price levels like static lines on a screen. They are the high-stakes footprints of institutional warfare. With over 70% of technical traders relying on these zones, your mastery of a support and resistance trading strategy is no longer just an advantage. It's your primary defensive shield in a 2026 market that just saw the landmark elimination of the FINRA Pattern Day Trader rule. This regulatory shift has opened the floodgates for retail participation, but only those with institutional-grade precision will survive the resulting volatility.
You've likely felt the sting of a "perfect" setup turning into a devastating fakeout. It's exhausting to enter trades too late or struggle with conflicting signals from a dozen cluttered indicators. This guide replaces that hesitation with a clear, rule-based framework for dominating the markets. You'll master the core pillars of technical analysis to identify high-probability entry points across any asset class. We'll preview the specific geometry of professional-grade S&R, explain how to set surgical stop losses, and show you how to leverage the TradingPRO infrastructure to execute with absolute confidence.
Key Takeaways
- Master the psychology of market memory to identify high-probability zones where institutional supply and demand reach equilibrium.
- Implement a precision-based support and resistance trading strategy by distinguishing between momentum-driven breakouts and high-accuracy reversal entries.
- Eliminate trade anxiety using the Average True Range (ATR) to set volatility-adjusted stops that protect your capital from market noise.
- Utilize multi-timeframe filters to align your execution with the dominant trend, ensuring every trade has the backing of major market players.
- Accelerate your performance by practicing these core pillars within the TradingPRO ecosystem, utilizing account tiers like the Rookie Account for real-market validation.
The Psychology of Support and Resistance: Why Markets Have Memory
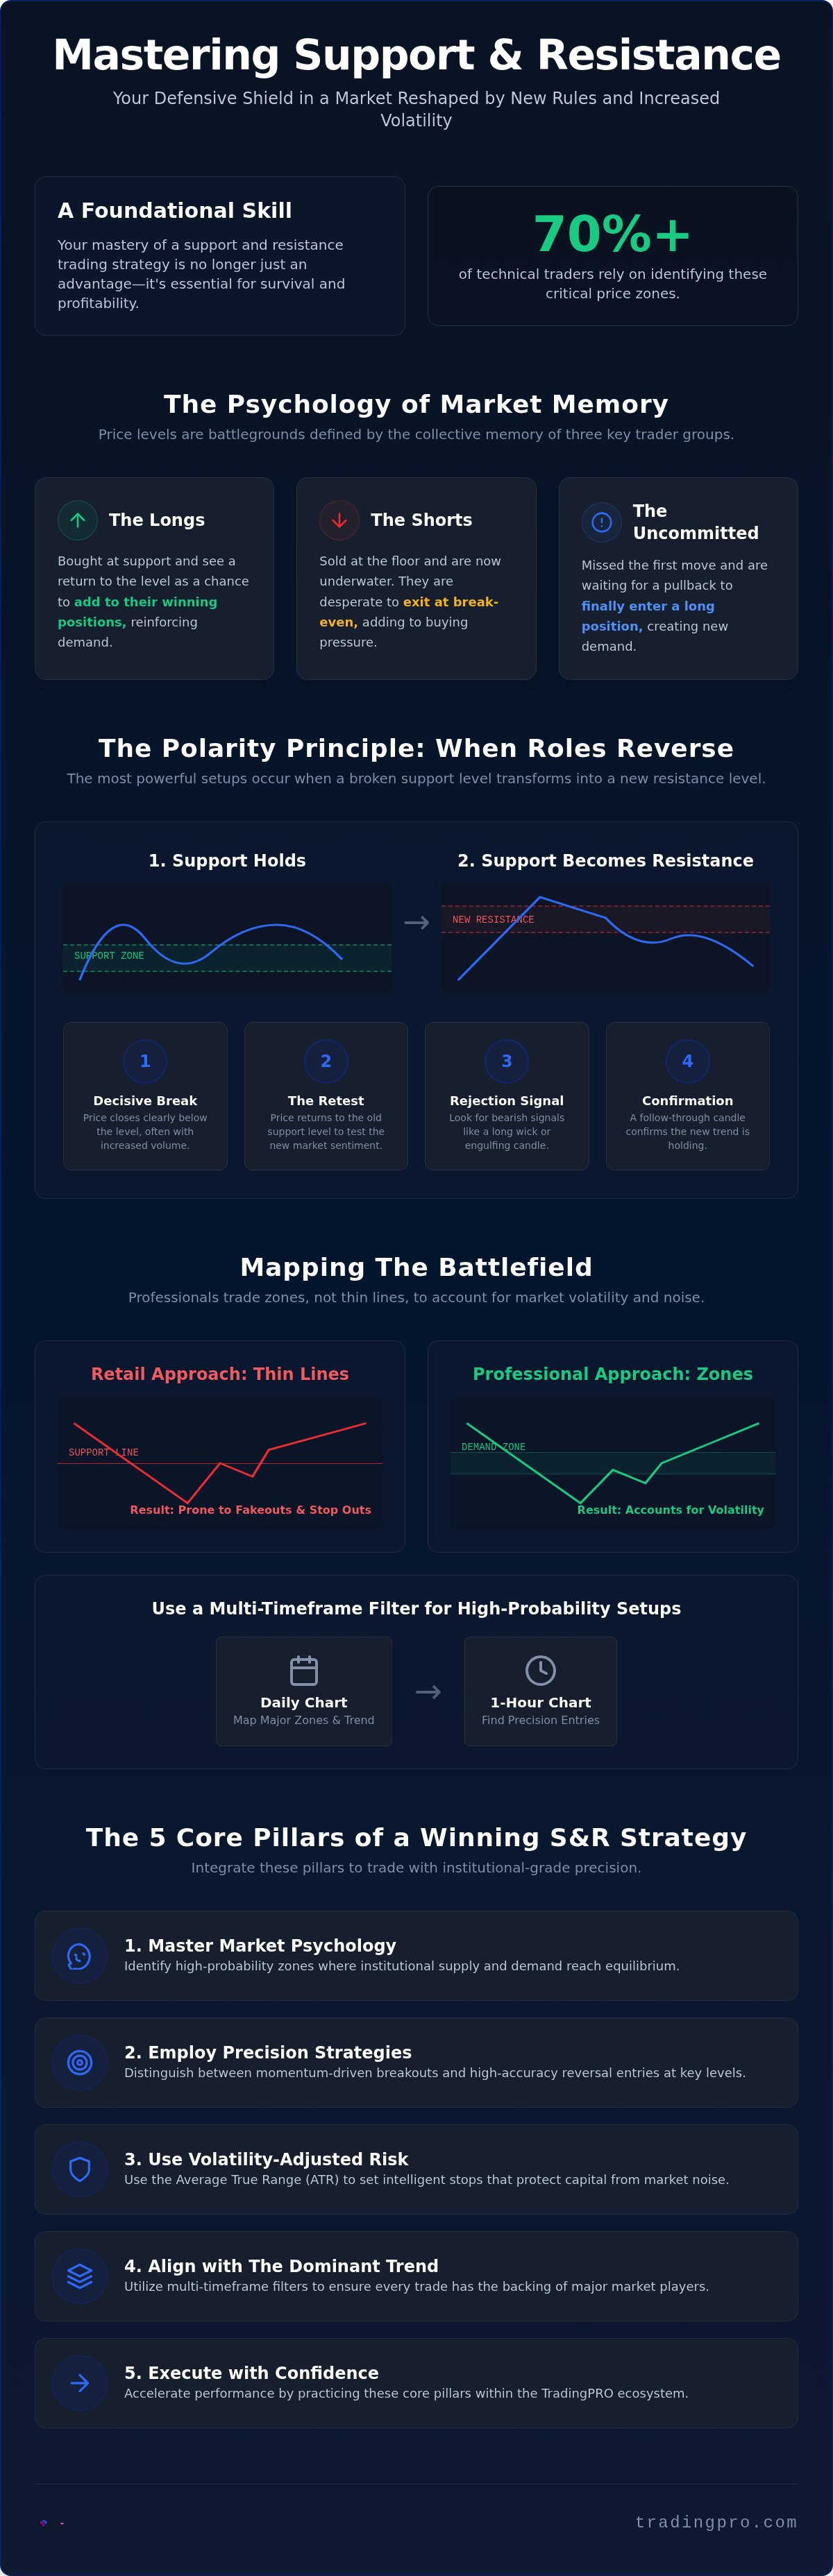
Market geometry isn't just a collection of lines on a chart. It's a visual representation of human emotion, greed, and regret. Every support and resistance levels represents a collective memory where buyers and sellers reached a temporary equilibrium. You can think of these as psychological "floors" and "ceilings." When price approaches these zones, it's not the math that causes a reversal; it's the traders' memory of what happened there last time. This memory creates a self-fulfilling prophecy that forms the backbone of a professional support and resistance trading strategy.
Three distinct groups of participants drive this price action. First, the longs who bought at support and want to add to their winning positions. Second, the shorts who sold at the floor and are now underwater, desperate to exit at break-even. Third, the uncommitted who missed the first move and are waiting for price to return so they can finally enter. Support is the price level where demand is strong enough to prevent further decline.
The Battle Between Bulls and Bears
Institutional dominance is visible through "Limit Orders." Large banks and hedge funds don't chase price. They park massive buy orders at known support levels, creating a "buy wall" that absorbs selling pressure. This institutional behavior creates the visible bounce retail traders look for. However, the real energy comes from the "Trapped Trader." When a breakout fails and price snaps back, those who chased the move are forced to liquidate. Their panic becomes your profit. This shift in market sentiment often hardens at specific price zones, making them easier to identify using tools like the Trade Hub for deep-tier analysis.
The Polarity Principle: When Support Becomes Resistance
The most powerful setups occur when a broken floor transforms into a new ceiling. This is the Polarity Principle. When support is decisively broken, the psychology of the market flips instantly. The buyers who were defended the level are now in pain. They wait for price to return to their entry point so they can exit with minimal loss. Their "sell" orders to exit long positions create the new resistance. It's a technical shift fueled by a psychological need for safety. You can practice identifying these shifts without high-stakes pressure by using a Rookie Account to build your recognition speed.
Role Reversal Checklist:
- Decisive Break: Price must close clearly beyond the level with increased volume.
- The Retest: Price returns to the old level to test the new sentiment.
- Rejection Signal: Look for a long wick or a bearish engulfing candle at the old support.
- Confirmation: A follow-through candle that signals the new trend is holding.
Mapping the Battlefield: Identifying High-Probability Zones
Ditch the thin lines. Professional traders don't look for a single price point; they hunt for Supply and Demand Zones. Market noise often pushes price slightly past a specific level before a reversal occurs. By drawing zones based on the wicks and bodies of previous Swing Highs and Swing Lows, you create a buffer that accounts for this volatility. Identify these structural anchors as the peaks and troughs where the market balance of power shifted. This shift is the first step in evolving your support and resistance trading strategy from a retail hobby to an institutional-grade operation.
Precision requires context. Start your analysis on the Daily chart to map the major battle lines. These are the levels that dictate the long-term trend. Once identified, drop down to the 1-Hour chart to find your entry. This multi-timeframe filter ensures you aren't fighting a tidal wave on a smaller scale. You should also watch for Psychological Levels. Round numbers like 1.1000 or 150.00 act as natural barriers because they are easy targets for limit orders. Understanding the market psychology behind support and resistance helps you anticipate where these massive order blocks reside.
Horizontal vs. Dynamic Support and Resistance
Horizontal levels are your primary tools in consolidating markets. They provide clear, unchanging boundaries for range-bound trading. In fast-moving trends, however, price rarely returns to a static floor. This is where dynamic S&R comes into play. Exponential Moving Averages (EMAs), such as the 50 or 200-period, act as mobile support that follows the price. While horizontal levels remain more reliable during high-volatility sessions, dynamic levels are essential for catching momentum bursts in trending environments.
The Three-Touch Rule for Level Validation
A single bounce is a fluke. Two touches create a potential zone. The third touch is the Golden Opportunity. This is the moment when the market confirms the level is significant, providing a high-probability entry point with a clear risk-to-reward ratio. Be careful not to overstay your welcome. Every time price tests a zone, it consumes the limit orders waiting there. Eventually, the level wears out. After four or five tests, the zone is likely to snap, leading to a violent breakout. To start mapping these zones with professional tools, you can register your account today and begin refining your edge.
Support and Resistance Trading Strategies: Reversals and Breakouts
Execution separates the elite from the liquidated. While mapping zones provides your tactical map, your support and resistance trading strategy provides the engine for profit. You must decide whether to play the reversal or ride the breakout. Both require surgical timing and an iron will. In a 2026 market defined by rapid retail participation, understanding these two entry types is the difference between capturing a move and being the liquidity for someone else's exit.
Strategy 1: The Bounce (Range Trading)
Range trading thrives on market exhaustion. When price approaches a proven floor or ceiling, look for "Exhaustion Candles" such as Dojis or Hammers. These signals indicate that the dominant side is losing steam. Your goal is to buy at the floor and sell at the ceiling. Aim for a minimum 1:2 Risk-Reward ratio by setting your targets at the opposite end of the range. This consistency builds the foundation of a professional portfolio. Practice this rhythm on a TradingPRO Rookie Account to master execution speed before scaling up to institutional volumes.
Strategy 2: The Momentum Breakout
Breakouts are high-octane events where a level finally snaps under pressure. Watch for patterns like Ascending or Descending Triangles where price repeatedly hammers against a zone. A genuine breakout is backed by institutional force. Verified market data shows that a reliable breakout requires a volume expansion of 50% or more above the daily average. If the volume stays flat, the move is likely a "fakeout" designed to trap retail traders. Waiting for a definitive candle close beyond the level is non-negotiable for protecting your capital.
The "Break and Retest" method is the professional gold standard for entering a new trend. It utilizes the polarity of Support and resistance to find a safer entry point after the initial momentum burst. You aren't chasing the move; you're waiting for the market to prove the new level holds.
The Break and Retest Checklist:
- Decisive Break: A candle must close completely outside the established zone.
- Volume Confirmation: Look for a 50% spike in volume to confirm institutional participation.
- The Return: Wait for price to pull back and touch the previous level (the retest).
- Rejection Signal: Identify a bullish or bearish rejection candle at the new floor/ceiling.
- Execution: Enter on the break of the rejection candle’s high or low with a clear exit plan.
Risk Management: Protecting Your Capital at the Edge
Precision execution is worthless without institutional-grade defense. Your support and resistance trading strategy only succeeds if you survive the "stop hunts" that liquidate retail amateurs. Most traders place their exits exactly on the support line. This is a fatal mistake. Institutions hunt these clusters of liquidity. Instead, utilize the "Safe Haven" Stop Loss. Place your exit outside the entire Supply or Demand zone to give the trade room to breathe during volatile tests.
Volatility is your biggest enemy. Use the Average True Range (ATR) indicator to set volatility-adjusted stops. If the ATR is high, your stop must be wider. This prevents you from getting stopped out by random market noise before the real move happens. Combine this with strict position sizing. Never risk more than 1% to 2% of your total account equity on a single setup. This ensures that even a string of losses won't compromise your long-term success. Your "Invalidation Point" is the exact price where your structural thesis is proven wrong. If price closes decisively beyond your zone, the trade is dead. Exit immediately. No hesitation.
Confluence: The Secret to High-Precision Entries
Stack the odds in your favor. Don't rely on a single level. Use confluence to filter out weak signals. Combining horizontal zones with the Relative Strength Index (RSI) identifies when a move is overextended. If price hits a resistance ceiling while the RSI is above 70, you have a high-probability reversal setup. Add Fibonacci Retracements to find "hidden" support levels that align with your horizontal zones. You can identify these institutional-grade confluence points using the Trade Hub, which streamlines complex data into actionable zones.
Managing the Trade: Trailing Stops and Scale-Outs
Securing profit is a skill. Once price moves in your favor and reaches the first minor resistance, move your stop loss to "Breakeven." You now have a risk-free trade. Don't wait for the final target to take everything off the table. Scale out. Take 50% of your position at the first major level and let the rest run with a trailing stop. This locks in gains while leaving room for a massive trend expansion. Respect the "No-Trade Zone." If the market is chopping in the middle of two major levels, stay out. Cash is a position. To execute these professional risk protocols with precision, register your account today and secure your capital.
Executing Your S&R Strategy with TradingPRO Infrastructure
Theory alone won't secure your profits. Precision in identifying zones is meaningless if your execution lags behind the market's movement. In the high-velocity environment of 2026, catching a bounce at a major level requires institutional-grade speed. When price hits a psychological ceiling or floor, the window for entry is often narrow. TradingPRO’s high-performance infrastructure ensures your orders hit the market instantly, allowing you to secure your position before spreads widen or momentum shifts. This technical edge is the final component of a successful support and resistance trading strategy.
You don't need to start at the top to trade like a professional. The Rookie Account provides a low-barrier sandbox where you can practice identifying Supply and Demand zones in real market conditions. It's the ideal environment to build your recognition speed and test the "Break and Retest" patterns discussed earlier. Once you've mastered the geometry of the market, you can scale your operations with the confidence of a seasoned authority. Your journey from a novice to a dominant market force is supported by a platform built for peak performance.
Rookie to Pro: Scaling Your Strategy
As your precision improves, your infrastructure should evolve with you. Transitioning from a Rookie Account to a ScalpX Account allows you to capitalize on high-frequency S&R moves with ultra-low latency. This multi-tier system is designed to support your growth at every stage of your career. To accelerate your progress, you can utilize the Deposit Bonus to increase your trading firepower safely. This additional margin provides a cushion while you refine your ability to set volatility-adjusted stops and manage institutional-sized positions.
Social Validation: The Ultimate Confirmation
You don't have to trade in isolation. The TradingPRO Social Feed allows you to cross-reference your manual analysis with elite strategy providers. If you've mapped a support zone on the Daily chart and see top-tier traders entering long at that exact level, you've found a high-conviction confluence point. This synergy between manual S&R mastery and social validation creates a "safe-haven" feel even in high-stakes environments. You can leverage Copy Trading to mirror the moves of experts who specialize in price action, providing a second opinion on your own technical thesis. Read more about Social Trading vs Copy Trading to enhance your edge and validate your zones against professional benchmarks.
Mastering market geometry is a commitment to excellence. By combining the psychological insights of support and resistance with the speed of TradingPRO, you position yourself as a proactive leader in the markets. Take the first step toward institutional-grade mastery today. The tools are ready. The zones are mapped. It's time to execute.
Dominate the Markets with Institutional Precision
You've moved beyond the retail fog. You now understand that a successful support and resistance trading strategy isn't about drawing random lines; it's about identifying the psychological battlegrounds where institutional liquidity lives. You've mastered the art of mapping high-probability zones, deploying the break-and-retest method, and shielding your capital with volatility-adjusted risk protocols. The geometry of the market is no longer a mystery. It's your roadmap to consistent performance and elite status.
It's time to put this institutional-grade knowledge into action. Whether you're validating your manual zones against the global Social Trading network or scaling your precision with a tailored $1 minimum deposit, our infrastructure is ready for your next move. Your security remains a priority with guaranteed Negative Balance Protection, providing the safe haven you need while pursuing peak performance in high-stakes environments.
Start your journey with a TradingPRO Rookie Account today. The markets are moving. Claim your edge and dominate the charts with the confidence of a seasoned authority.
Frequently Asked Questions
Is support and resistance the best strategy for beginners?
Yes, it is the definitive foundation for any newcomer. It offers a clear visual map of market psychology without the confusion of lagging indicators. Mastering a support and resistance trading strategy allows you to see where institutional players are placing their bets, providing a professional edge from day one. It's the most reliable way to understand price action before moving to complex systems.
How do I know if a support level will hold or break?
You identify a hold or break by watching price action at the edge of the zone. A hold is confirmed by long rejection wicks or exhaustion candles like hammers. A break is signaled by strong, full-bodied candles closing beyond the level, typically accompanied by a volume spike of 50% or more above the average. Institutional force is always visible through these momentum shifts.
What timeframe is best for drawing support and resistance?
Higher timeframes like the Daily and Weekly charts provide the most significant structural levels. Professional traders map these major zones first to understand the dominant trend. They then drop down to the 1-Hour or 15-Minute charts to find precise entry points. This ensures their execution aligns with institutional flow while minimizing the noise found on smaller scales.
Can I trade support and resistance on all assets like Forex and Commodities?
Market geometry is a universal language across all liquid asset classes. Whether you trade Forex majors or Commodities like Gold, the same principles of supply and demand apply. Human psychology doesn't change based on the instrument. The battle between buyers and sellers remains constant globally, making these zones effective in any high-volume market.
Why do support and resistance levels sometimes fail?
Levels fail when institutional order flow shifts or high-impact economic news enters the market. Support and resistance aren't unbreakable barriers; they are dynamic zones where the balance of power is tested. When enough aggressive selling hits a support floor, the limit orders are absorbed and price moves lower. No level is permanent in a fast-moving landscape.
Should I use indicators with support and resistance?
Use indicators only to provide confluence for your primary analysis. Tools like the RSI can signal if a market is overextended as it hits a resistance ceiling, increasing the probability of a reversal. Focus on one or two high-impact tools rather than cluttering your screen. Excessive indicators cause hesitation during critical execution moments where speed is your greatest asset.
How many times can a level be tested before it is likely to break?
Most levels begin to weaken after three or four tests. Each time price touches a zone, it consumes the available limit orders parked there. Once that liquidity is exhausted, the level snaps and a breakout occurs. This is why the third touch often provides the highest probability reversal entry before the risk of a breakout increases significantly.
What is a "false breakout" and how do I avoid it?
A false breakout occurs when price briefly pierces a level to trap retail traders before reversing sharply. You avoid this by demanding a decisive candle close beyond the zone. Professional execution often involves waiting for the "break and retest" to confirm that the old resistance has truly flipped into new support. This patience ensures you aren't providing the liquidity for institutional reversals.


