




- Published on: 2026-07-26 10:05:00
Technical Analysis for Beginners PDF: The 2026 Master Roadmap to Market Precision

Stop guessing where the market is going and start reading the footprints left by institutional capital. Precision is the only currency that matters in a high-stakes environment. You've likely felt the sting of emotional entries or the paralyzing fog of information overload from generic tutorials. It's frustrating to watch a setup trigger only after you've hesitated; it's even worse to enter a trade just as the momentum reverses.
We understand that you want to trade with the confidence of a seasoned authority. This guide provides the ultimate technical analysis for beginners PDF to help you decode market movements with surgical precision. You'll gain the framework needed to transition from a guessing rookie to a data-driven trader who knows exactly when to strike. We're here to help you move beyond the noise of 150 million retail participants and claim your competitive advantage.
In this master roadmap, we provide a clear checklist for trend identification and the exact data points you need to execute trades with certainty. You'll discover how to master entry and exit points while mapping out a frictionless path from a demo environment to a live TradingPRO Rookie account. Get ready to transform your approach and trade with the gravitas of a global leader.
Key Takeaways
- Master the three core premises of market psychology to understand how price action discounts all known information instantly.
- Access the technical analysis for beginners PDF to identify market trends and decode candlestick patterns with institutional precision.
- Utilize moving averages and the "Golden Cross" to pinpoint high-probability entry zones while stripping away emotional bias.
- Execute a professional multi-timeframe strategy that aligns daily trends with critical support and resistance levels.
- Accelerate your results by transitioning from static theory to mirroring elite traders through Social Trading.
What is Technical Analysis? Decoding the Language of the Markets
Technical analysis isn't just about reading lines on a screen. It's about mastering the collective mind of the global market. At its core, technical analysis is the study of historical price action and volume to identify high-probability setups. While fundamental analysis looks at financial health, technical analysis focuses on the raw data of the trade itself. You aren't guessing where the price should be; you're observing where it is actually going. This discipline provides a comprehensive overview of technical analysis by treating price as the ultimate source of truth.
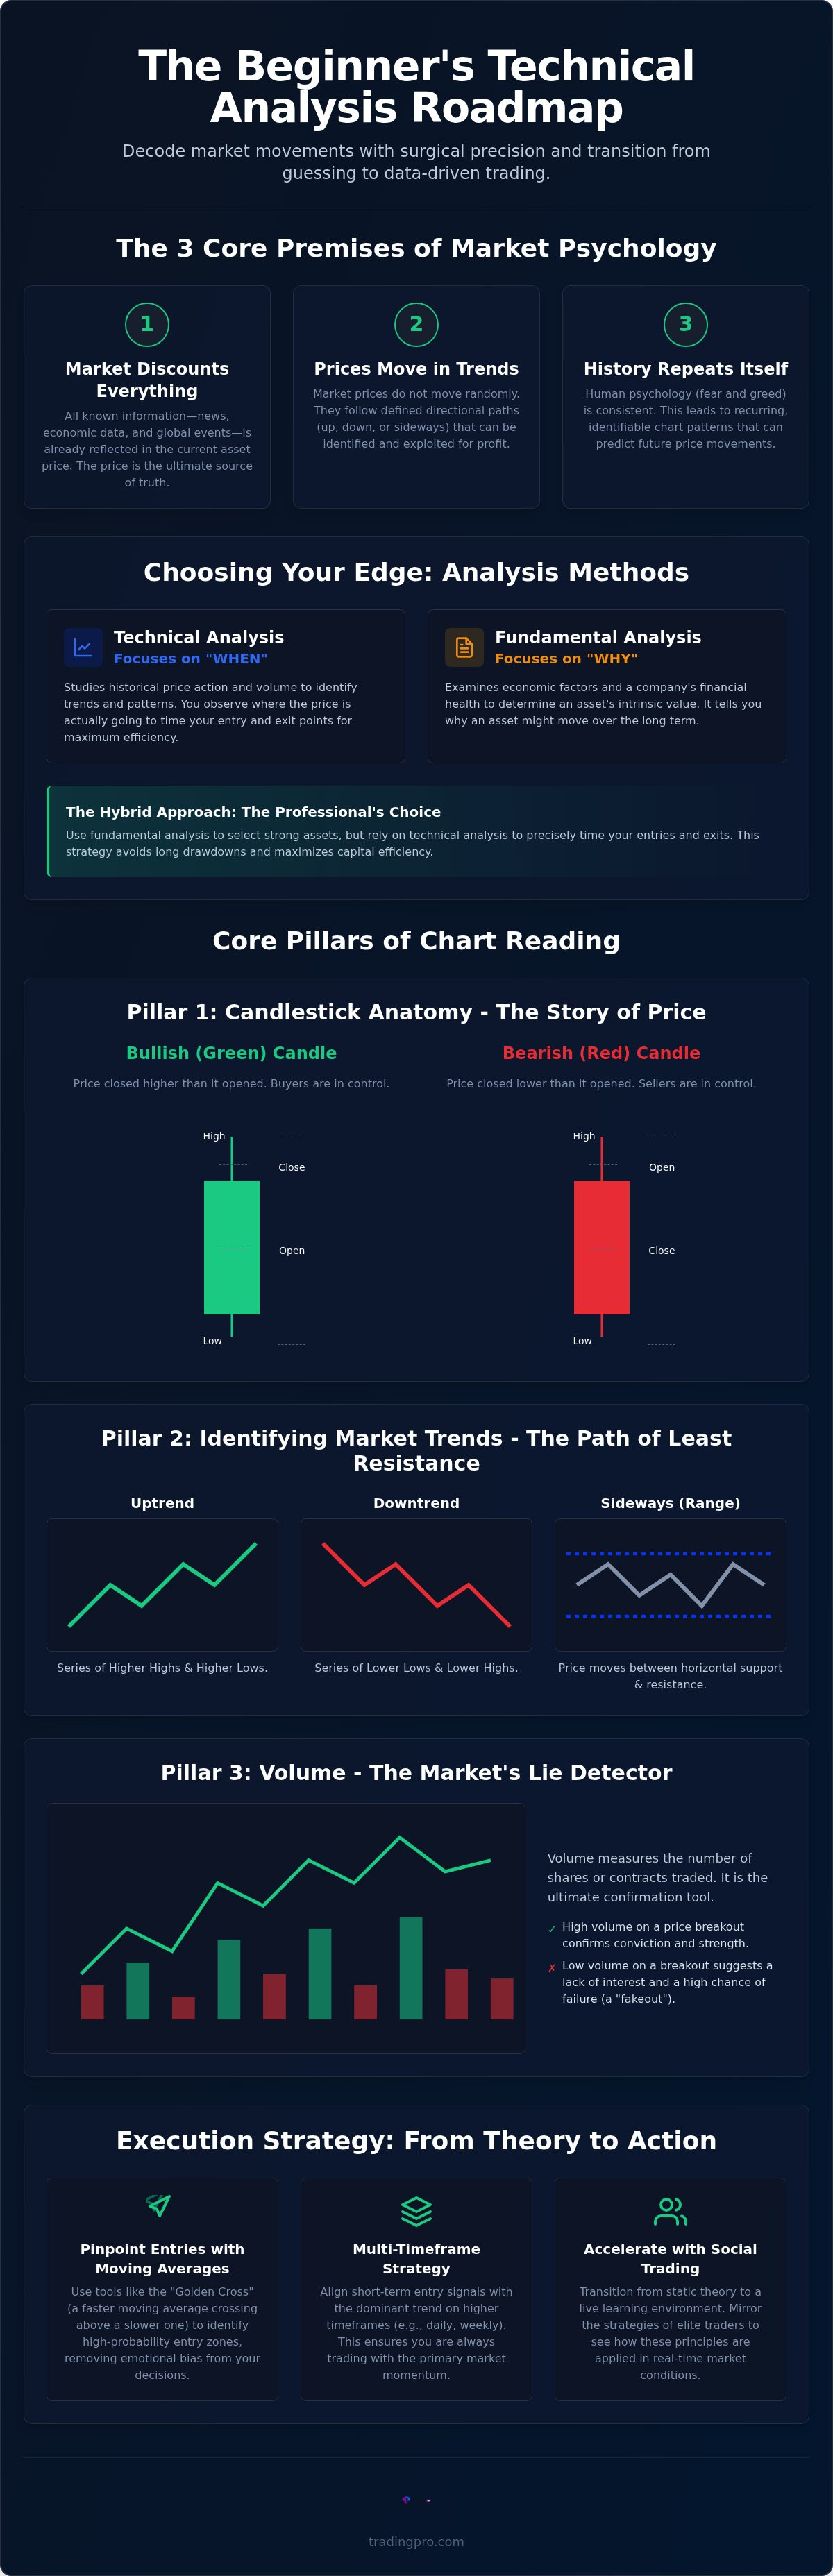
To dominate in the 2026 market, you must understand the three core premises that govern every chart. First, the market discounts everything. Every piece of news, every economic shift, and every geopolitical event is already reflected in the price. Second, prices move in trends. They don't move randomly; they move in defined directions that you can exploit. Third, history repeats. Humans react to fear and greed in predictable ways, creating patterns that appear again and again. Our technical analysis for beginners PDF breaks these concepts down into actionable steps you can apply immediately.
In a landscape defined by 20% annual growth in retail trading, technical analysis serves as your primary BS detector. Headlines and social media hype often create "noise" designed to trigger emotional reactions. Technical analysis allows you to cut through that clutter. You'll stop reacting to what people say and start responding to what the data shows. It's the difference between being a victim of market volatility and being a beneficiary of it.
Technical vs. Fundamental Analysis: Choosing Your Edge
Fundamental analysis tells you "why" an asset might move over the long term. Technical analysis tells you "when" to enter or exit to maximize efficiency. Beginners often struggle with long-term holds because they enter at the wrong time. We recommend a hybrid approach. Use fundamentals to pick your assets, but use technicals to time your execution. This ensures you aren't stuck in a drawdown while waiting for a "good" company's stock to finally start climbing. Start with a Rookie Account to practice this timing without the pressure of institutional-sized risk.
The Psychology of Price Action
Every candlestick on your chart is a physical record of a battle between bulls and bears. When you see a support level hold, you're seeing a zone where buyers have collectively decided an asset is undervalued. When a resistance level breaks, you're witnessing the "herd mentality" shifting toward aggression. Success requires you to stop thinking like a retail trader and start thinking like a market technician. You must transition from emotional reactions to data-driven execution. By using the Trade Hub, you can access advanced insights that reveal these psychological shifts in real-time, giving you the confidence to strike when the probability is highest.
The Essential PDF Toolkit: Core Pillars of Chart Reading
Visualizing market intent requires a standardized toolkit. This technical analysis for beginners PDF serves as your high-performance blueprint for reading the tape with institutional precision. You've learned the "why" behind price action; now you must master the "how" of visual execution. Every chart is a map of human emotion, and these pillars are your coordinates for navigating it successfully.
Every candlestick tells a specific story through four data points: Open, High, Low, and Close (OHLC). The candle's body represents the range between the open and close, while the wicks reveal the price extremes reached during that session. By analyzing these four points, you can instantly see who is in control. A long green body shows aggressive buyers, while a long red body confirms dominant sellers. It's the most efficient way to gauge market sentiment at a glance.
Markets move in three primary directions. Uptrends feature a consistent series of higher highs and higher lows. Downtrends consist of lower lows and lower highs. Sideways markets, or ranges, occur when the price is trapped between two horizontal levels. Identifying the trend early is your greatest competitive advantage. Trading against a strong trend is a rookie mistake that leads to unnecessary losses. Always align your execution with the path of least resistance.
Volume acts as the market's lie detector. It measures the total number of shares or contracts traded during a specific period. Volume confirms conviction. A price breakout without a surge in volume is often a "fakeout" designed to trap retail traders. Conversely, a move backed by heavy trading activity suggests institutional commitment. When you're ready to apply these pillars on a live chart, you should open your trading account to gain full access to institutional-grade tools and real-time data.
Mastering Candlestick Patterns for 2026
Patterns like the Doji represent market indecision, while the Hammer and Engulfing candles signal powerful shifts in momentum. Long wicks are your best friend; they highlight price rejection in real-time. A Pin Bar is a single-candle signal characterized by a small body and a long wick that indicates an immediate trend reversal. Master these patterns to anticipate moves before they happen.
Support and Resistance: The Trader's Map
Support and resistance are the floors and ceilings of the market. Static levels are fixed horizontal zones where price has historically stalled. Dynamic levels move with the price, often visualized through Moving Averages. The "Role Reversal" principle is a cornerstone of technical trading; it occurs when a broken resistance level becomes a new floor for future price action. Draw your trendlines by connecting at least three clear swing points, but never force a line that isn't naturally there.
Top Indicators and Chart Patterns for Beginners
Precision requires the right filters. While price action remains your primary signal, indicators act as your secondary confirmation tools. Think of this technical analysis for beginners PDF as your tactical overlay for the live charts. We categorize these tools into three distinct groups: Trend-following, Oscillators, and Volatility indicators. Each serves a specific purpose in your execution strategy. You don't need a hundred tools; you need a few high-performance ones that work in sync.
Trend-following tools like Moving Averages help you ride the momentum with institutional stability. The Simple Moving Average (SMA) provides a smooth baseline for long-term trends, while the Exponential Moving Average (EMA) reacts faster to recent price shifts. You should watch for the "Golden Cross" specifically. This occurs when a short-term MA, like the 50-period, crosses above a long-term MA, like the 200-period. It's a definitive signal that a major bullish shift is underway. This isn't a guess; it's a mathematical reflection of shifting market dominance.
The Power of Oscillators in Volatile Markets
Oscillators like the Relative Strength Index (RSI) are essential for avoiding the "buy high" trap during parabolic moves. When the RSI climbs above 70, the market is overbought. When it drops below 30, it's oversold. Use the Moving Average Convergence Divergence (MACD) to spot momentum shifts before they appear on the price line. Avoid "Indicator Soup" by loading your screen with too many conflicting tools. This trap paralyzes beginners and leads to missed opportunities. Stick to two or three indicators that complement your core strategy for a frictionless experience.
Classic Chart Patterns You Can't Ignore
Patterns are the geometric signatures of market sentiment. Reversal patterns like the Head and Shoulders or Double Tops warn you that the current trend is exhausted and a correction is imminent. Conversely, continuation patterns like Bull Flags and Pennants indicate the market is just catching its breath before the next leg up. Identifying these structures allows you to anticipate the next move with surgical accuracy. A breakout occurs when price closes decisively outside the pattern boundary, usually backed by a surge in volume. You can practice identifying these setups in the Trade Hub to build your visual intuition and trade with confidence. Transitioning from theory to execution becomes seamless once you recognize these recurring market footprints.
Execution Strategy: From PDF Theory to Live TradingPRO Results
Static theory is a liability in a dynamic market. You have identified the patterns and filtered them through indicators; now you must bridge the gap between analysis and execution. This technical analysis for beginners PDF is designed as a battle plan, not a textbook. Precision execution requires a repeatable, five-step process that eliminates hesitation and replaces it with institutional-grade discipline.
- Step 1: Identify the primary trend on a higher timeframe. Use the Daily or 4H charts to ensure you are trading with the dominant momentum.
- Step 2: Locate key support and resistance zones. These are your high-probability fields of engagement where institutional orders are likely waiting.
- Step 3: Wait for a candlestick trigger. Never enter based on a "feeling." A Bullish Engulfing candle at a support zone is a definitive signal to strike.
- Step 4: Set your Stop Loss and Take Profit. Use technical levels to define your exit points. Greed has no place in a precision-driven strategy.
- Step 5: Execute via the TradingPRO Rookie Account. This environment allows you to test these PDF theories with real-market speed while maintaining tight control over your risk.
Most traders fail because they treat execution as a guessing game. By following this structured roadmap, you transform from a retail spectator into a focused technician. You aren't just placing a trade; you're following a proven system designed for peak performance.
The Golden Rule: Risk Management and R:R Ratios
Survival precedes success. A 1:2 Risk-to-Reward ratio is your absolute minimum requirement for long-term profitability. This mathematical edge means you can be wrong more than half the time and still grow your capital. Calculate your position size so you never risk more than 1-2% of your total balance on a single setup. We provide Negative Balance Protection as your ultimate safety net, ensuring your losses never exceed your initial investment. It's the institutional standard of security for the ambitious trader.
Leveraging the Trade Hub for Technical Insights
Automation is the future of market precision. You can use the TradingPRO Trade Hub to automate your market scanning and identify setups across dozens of assets instantly. This tool integrates institutional-grade sentiment data directly with your technical charts, allowing you to see where the "smart money" is leaning. Move beyond manual drawing and set automated technical alerts that notify you the moment your trigger condition is met. Ready to put your strategy to work? You should register your account today and start trading with the tools of a global leader.
The Future of Learning: Social Trading as Your Live PDF
Static theory is your foundation, but the market is a live organism. While a technical analysis for beginners PDF provides the essential logic, the 2026 market moves at institutional speeds that demand real-time adaptation. You cannot master "Chart Vision" in a vacuum. You need to observe how professional technicians react when a support level fails or when volatility spikes unexpectedly. Social Trading transforms your learning process from a solitary academic exercise into a high-performance mentorship. It's the fastest way to bridge the gap between reading a chart and executing a trade with precision.
The global social trading market has surged to a valuation of $2.82 billion in 2026. This growth isn't just about convenience; it's about transparency. By watching expert analysts execute in real-time, you see the application of the theories you've studied. You aren't just looking at a historical pattern; you're witnessing the decision-making process behind a live entry. This allows you to reverse-engineer successful trades and understand the nuance of momentum that a static document simply cannot capture. With 73% of social trading interactions now happening via mobile apps, you can monitor these institutional-grade strategies from anywhere.
Copying vs. Learning: A Dual-Track Success Strategy
Success in this environment requires a dual-track approach. You should use Social Trading to earn while you continue to master the technicals. Don't just mirror trades blindly. Analyze the "Master" trader's charts to see exactly where they place their stop losses and take profit targets. Identify the specialists on the TradingPRO network who align with your preferred style, whether it's trend-following or scalp trading. This active observation reinforces your study of the technical analysis for beginners PDF and builds the confidence needed for independent execution.
Next Steps: Your Roadmap to Pro Status
Your journey doesn't end with a single successful trade. It's about consistent excellence and scaling your performance. Once you've mastered the basics in a Rookie environment, you should transition to a ScalpX account for high-speed execution and tighter spreads. Maintain a rigorous trading journal to track your technical accuracy and refine your "BS detector" against market noise. The tools are ready, the infrastructure is secure, and the opportunity is yours to claim. Register now to start your technical journey and join the elite ranks of precision-driven traders.
Master the Charts and Claim Your Dominance
You now possess the high-performance framework required to decode market movements with surgical precision. By mastering candlestick anatomy and identifying the "Golden Cross," you've moved far beyond the noise of retail guessing. This technical analysis for beginners PDF is your tactical blueprint for identifying high-probability zones where institutional speed meets opportunity. You've learned that survival depends on strict 1:2 risk-to-reward ratios and the ability to strip away emotional bias from every entry. This knowledge is your primary competitive advantage in a landscape that punishes the unprepared.
Real mastery happens in the live arena. You're ready to leverage our global multi-asset infrastructure and institutional-grade Trade Hub tools to refine your execution. Transition from a student of the charts to a decisive technician. We provide the stability and elite tools necessary for your long-term success. Start Your Trading Journey with a TradingPRO Rookie Account today. The 2026 market doesn't wait for the hesitant; it rewards the precise and the prepared. Claim your edge and trade with the confidence of a global leader.
Frequently Asked Questions
Is technical analysis better than fundamental analysis for beginners?
Technical analysis provides a faster learning curve for beginners because it focuses on visible price action instead of complex financial reports. While fundamental analysis tells you why an asset should move, TA shows you when it is actually moving. This timing is critical for managing risk. Most new traders find that mastering chart patterns gives them immediate, actionable data to use on their platform.
What is the best technical analysis indicator for a Rookie account?
The Relative Strength Index (RSI) and Moving Averages are the most effective tools for a Rookie account. These indicators strip away market complexity and provide clear overbought or oversold signals. When you combine them with Trade Hub insights, you gain a professional edge that simple price observation cannot match. It's the most efficient way to build your visual intuition quickly.
Can I learn technical analysis for free using a PDF?
You can absolutely master the foundational theories for free. A comprehensive technical analysis for beginners PDF provides the modular structure needed to understand candlesticks and trendlines without an upfront investment. However, theory alone is insufficient. You must eventually bridge the gap between static documents and live market speed by observing expert execution on a social trading network to see how these theories apply in real-time.
How much capital do I need to start practicing technical analysis?
You don't need significant capital to begin. The focus shouldn't be on the dollar amount but on your percentage of accuracy and risk management. Platforms offering Rookie or Micro accounts allow you to test your PDF theories in a live environment with minimal financial exposure. This ensures you can refine your strategy while keeping your capital safe during the critical learning phase.
Does technical analysis work for all assets, including Forex and Commodities?
Technical analysis is effective across all liquid markets including Forex, Commodities, and Indices. Because these markets are driven by the collective psychology of millions of participants, the same patterns repeat regardless of the asset. Whether you are trading gold or major currency pairs, the herd mentality reflected in support and resistance levels remains a consistent and exploitable force across the globe.
How long does it take to master technical analysis?
Developing a solid understanding usually takes three to six months of dedicated study. Mastering the nuance of "Chart Vision" takes longer and requires consistent live market experience. You'll move faster if you combine your study with tools like the Trade Hub. This helps you identify setups in real-time, accelerating your transition from a novice spectator to a precision-driven technician who trades with confidence.
Is technical analysis 100% accurate?
No analysis method is 100% accurate. Technical analysis is a tool for identifying high-probability zones where institutional capital is likely to move. It's about shifting the odds in your favor over a large sample of trades. This is why risk management and a minimum 1:2 risk-to-reward ratio are mandatory for long-term survival. You are trading probabilities, not certainties, and your discipline is what ensures profitability.
What is the difference between a leading and a lagging indicator?
Leading indicators like the RSI attempt to predict price reversals before they happen. Lagging indicators like Moving Averages confirm that a trend is already underway. Most elite traders use a combination of both to build a robust strategy. Leading indicators offer early entry signals, while lagging indicators provide the institutional stability needed to stay in a winning trade until the momentum truly shifts.


